Hey everyone,
I hope you had a great week, let’s get into it.
Portfolio & Market Updates
My portfolio was down -2.8% this week, well behind the S&P 500 (-1.2%), and Nasdaq 100 (-1.1%). Small caps were interesting, as Ark was down (-5%), but small cap growth $IWO was relatively unchanged (-0.3%).

Why did small cap growth outperform $ARKK? Consider $IWO’s top holdings:
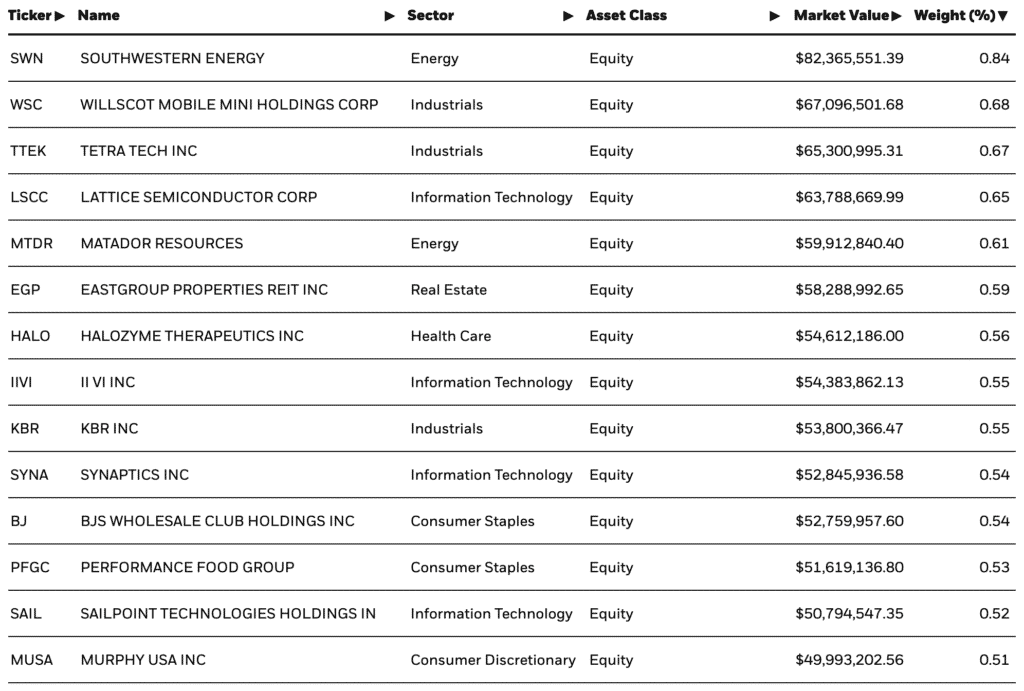
Something tells me that Ark’s top holdings aren’t in energy or industrials. In fact, Ark’s top three are Zoom, Tesla, and Roku.
Back to my drawdown, which was really thanks to my holdings in Roku & Twilio, who were both hammered on Friday. Both of these companies are constant reminders that my trend following strategy will prevent significant pain in the future. Obviously with a crystal ball I would have sold these names despite implementing this after their trends broke down, but both keep executing from a business perspective, and their valuations are near all-time lows.
The S&P 500 closed below this mini channel I had been tracking, which started on May 20th.
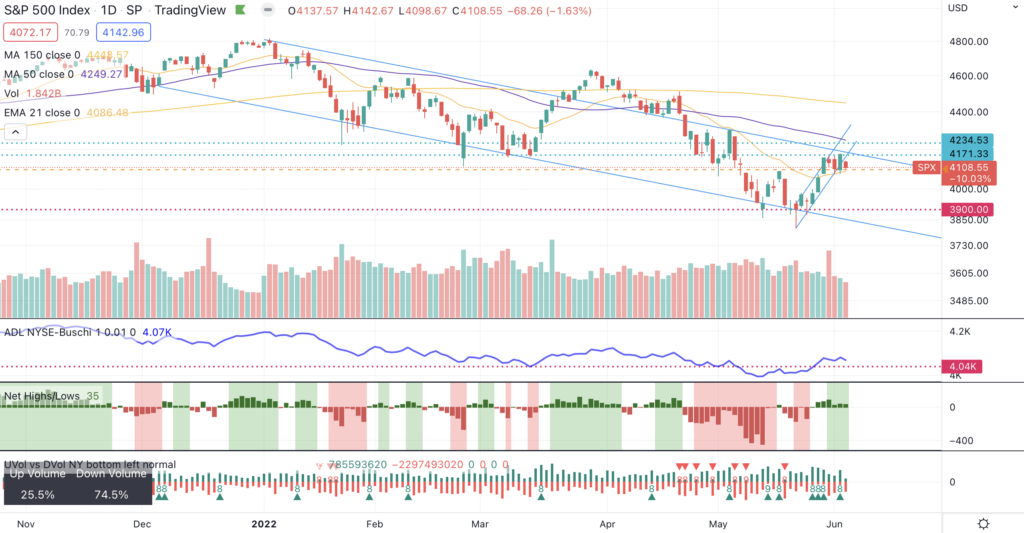
I was clearly surprised, as I took a quick bet on this rebound by buying the S&P 500 ETF $SPY. As we can see, more companies made net highs for the 7th consecutive day on the S&P 500, showing clear investor demand.
Despite that close, I’m still leaning bullish due to the May 26th follow through day, as well as the impressive breadth.
Breadth Shows Bulls Still Have the Ball
We’ll start with my general Nasdaq chart, showing that the FTD from May 26th is still in place. So far, this looks like a consolidation. Price closing above a rising 21-day moving average is constructive as well, as I mentioned last week.
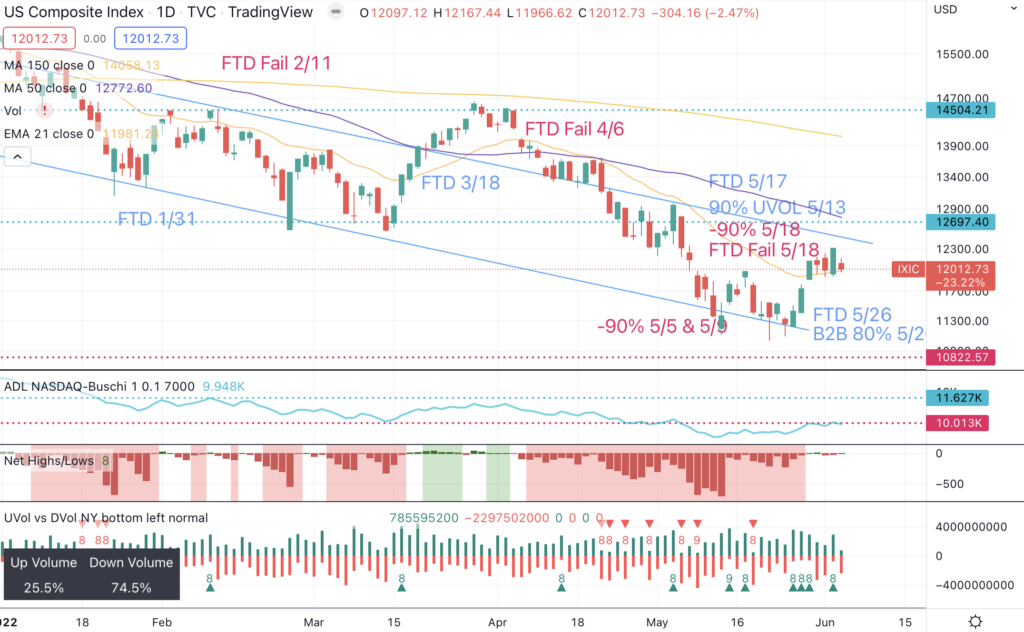
Notice those four green 80% arrows at the bottom of the chart. I wrote last week that there were three consecutive upside days, showing how strong the returns were when this occurs.
But what about 4 >80% upside days over 6 days? Thankfully, Mark Ungewitter did the homework.
Not a bad time to be buying stocks, and while we saw a retest occurred between 2015-2016, there was still more than enough time to capture some gains before rolling back to cash. This is yet another reason why I’m net long.
Small caps are also maintaining their relative strength, as we can see the Russel 2000 outperforming the S&P 500 since May 11th.
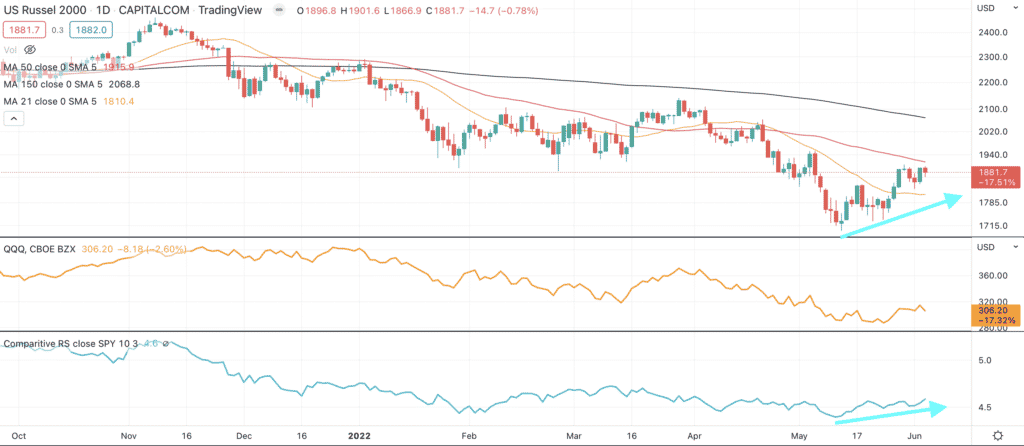
I have long said that small caps should start the next bull market, as they were the ones who broke down first. While I’m unsure if this is the start of another bull, or just a bear market rally (we’ll need more breadth for confirmation), this is a constructive start.
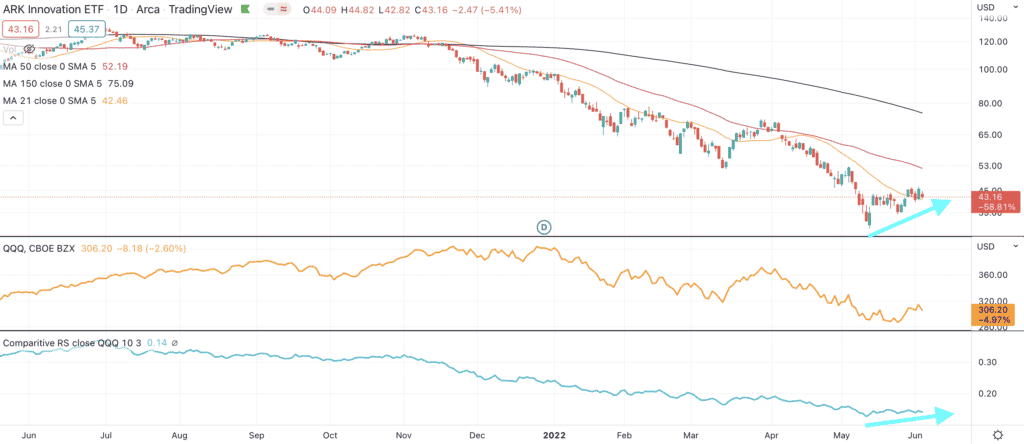
Ark is also showing similar relative strength.
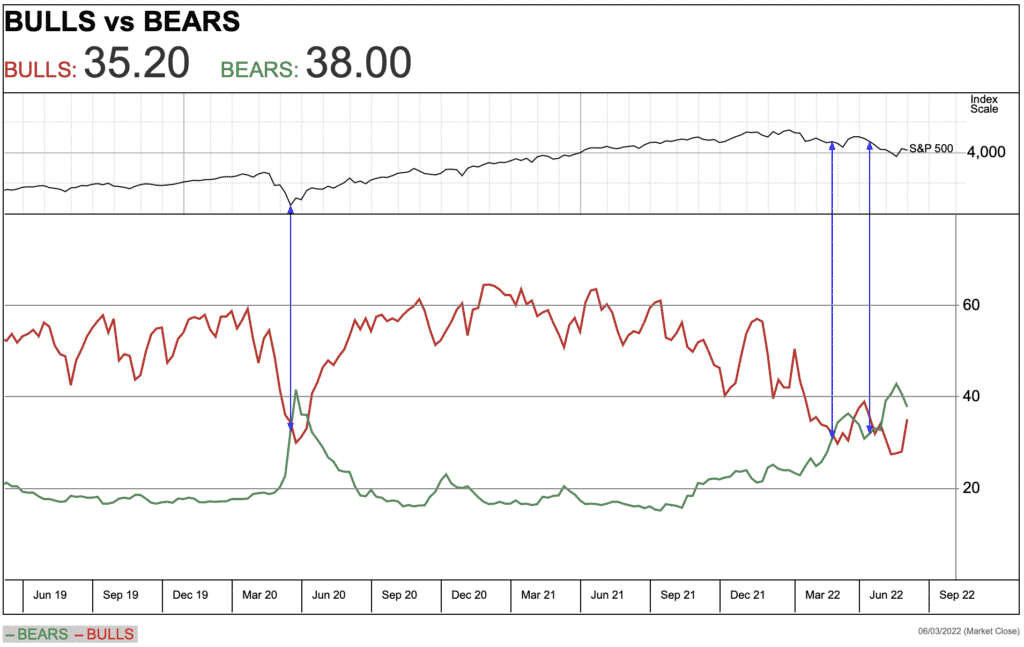
Still More Bears than Bulls
Finally, despite a large improvement in bullishness this week, there are still more bears than bulls. The Investors Intelligence sentiment index shows that we have more bears than bulls for far longer than the COVID crash.
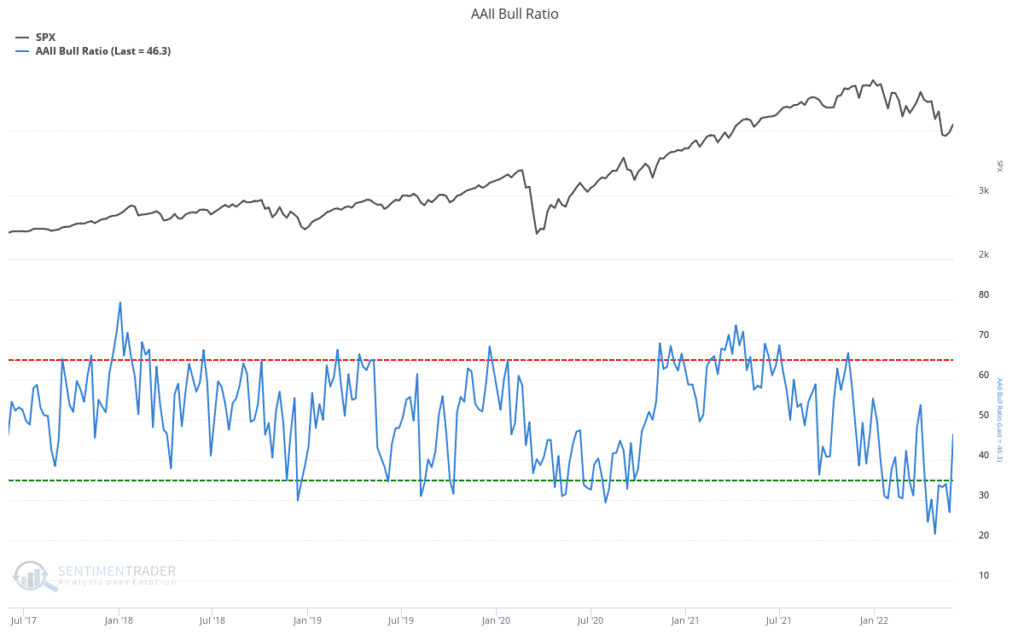
The AAII index shows the strong bullish rebound I mentioned, but the ratio still favors the bears.
Once you zoom out, you’ll see how bearish the longer term sentiment is. Applying a 20-week moving average to this (green line below), and you’ll see that this is our most bearish point over the past 20 years. the light blue line is our current level.
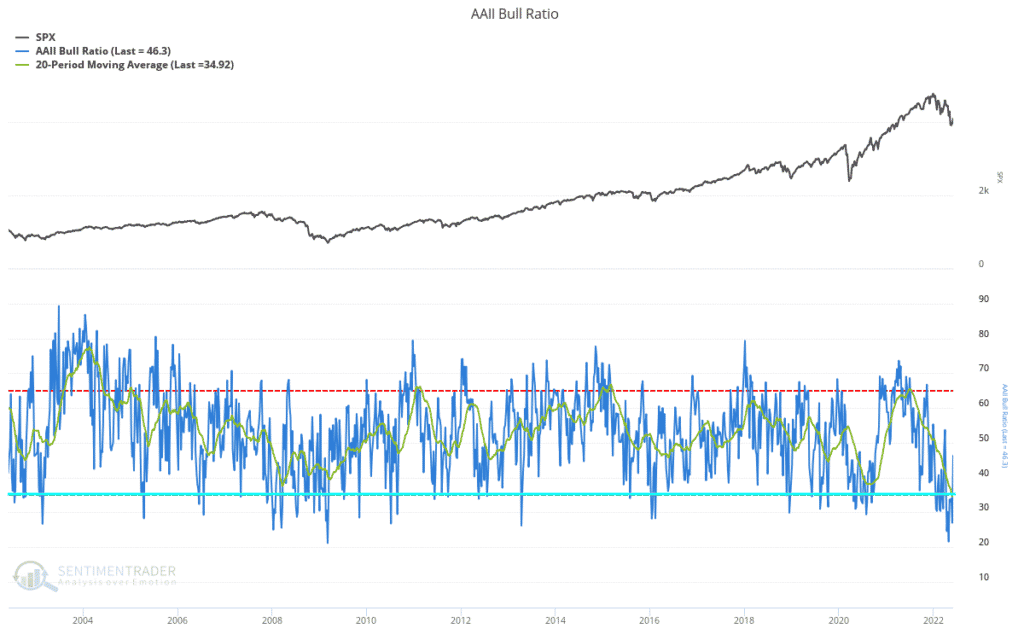
It’s crazy imaginging that even the financial crisis wasn’t this bearish for this long.
Market Trends & Kingsoft Cloud’s Relative Strength
Which takes us to market trends. The shorter term trends are still looking good, while China and green energy are still showing their relative strength. Bonds got killed, but $TLT is still above May 9th lows.
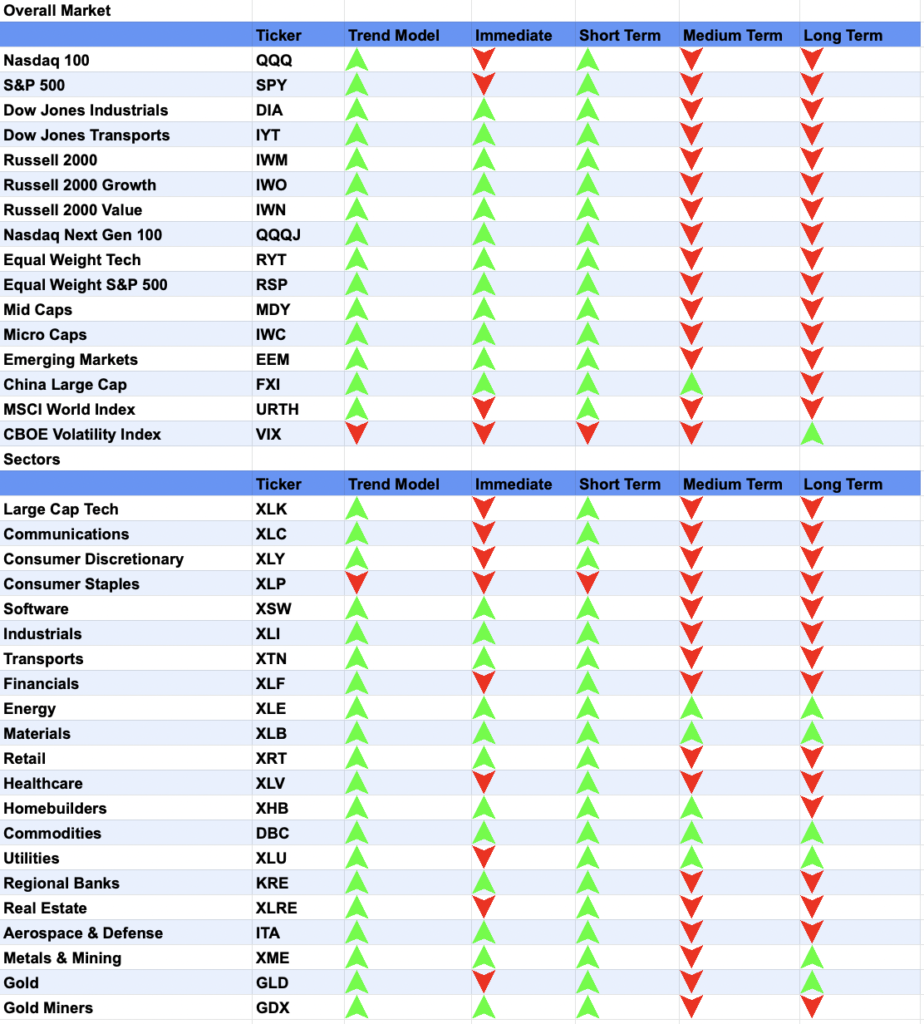
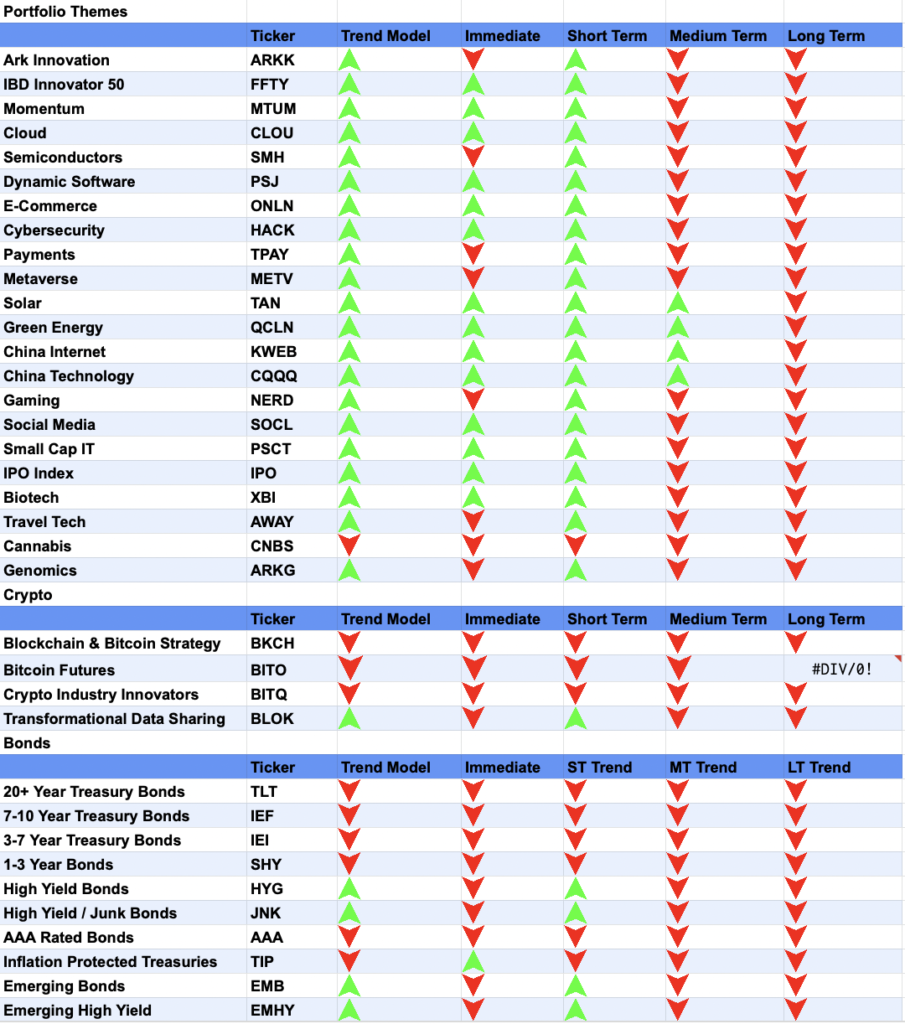
As for China, Pinduoduo has been a decent winner, up roughly 17% all in so far. Two more names I have been tracking report earnings next week, and I plan on opening positions if their earnings are received well.
One of these names, believe it or not, is Kingsoft Cloud $KC. This was the only China holding I held on to once the market started correcting last year, and I paid dearly for it. Fast forward to today, and you’ll see their relative strength.
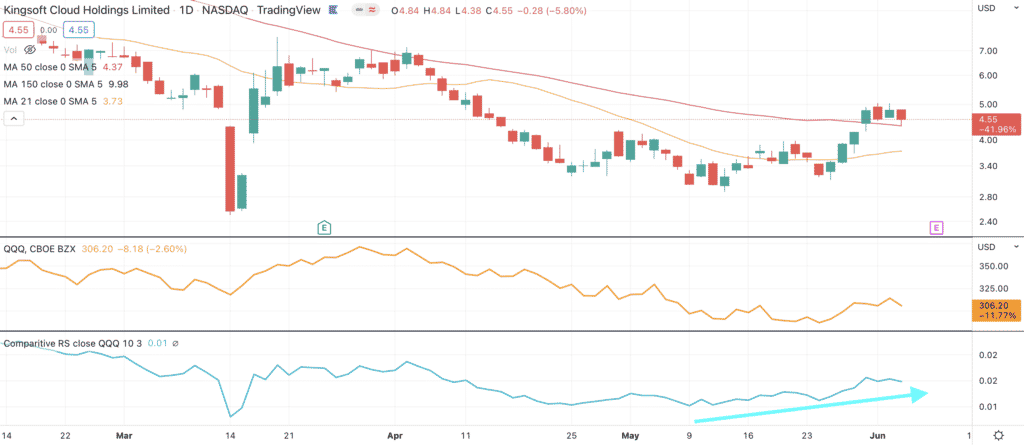
Before going any further, if you were asked how much the largest independent public cloud in China was worth, what would you guess? What if I told you their revenues were $1.4 billion?
Datadog is trading at 29x sales, and Snowflake is trading at 31x sales. Alibaba, which has a large public cloud presence in China, is trading at 2.1x sales.
Kingsoft on the other hand? 0.86x sales, for $1.2 billion.
Part of this is thanks to negative cash flow, and Kingsoft forecasted that they will have positive EBITDA margins by EOY 2022. Next week’s earnings will show whether they are heading in this direction. If they are, I may open a position now.
Opened & Closed: Magnite (MGNI) & XPeng (XPEV)
Long time subscribers know how bullish I am on Magnite & XPeng. I believe both will lead to multi-bagger returns (Magnite already has), and I opened a position in both once they closed above their 50-day moving averages.
The weekly charts of both show why the 50-day moving average is so important to me. Consider the weekly chart of Magnite first.
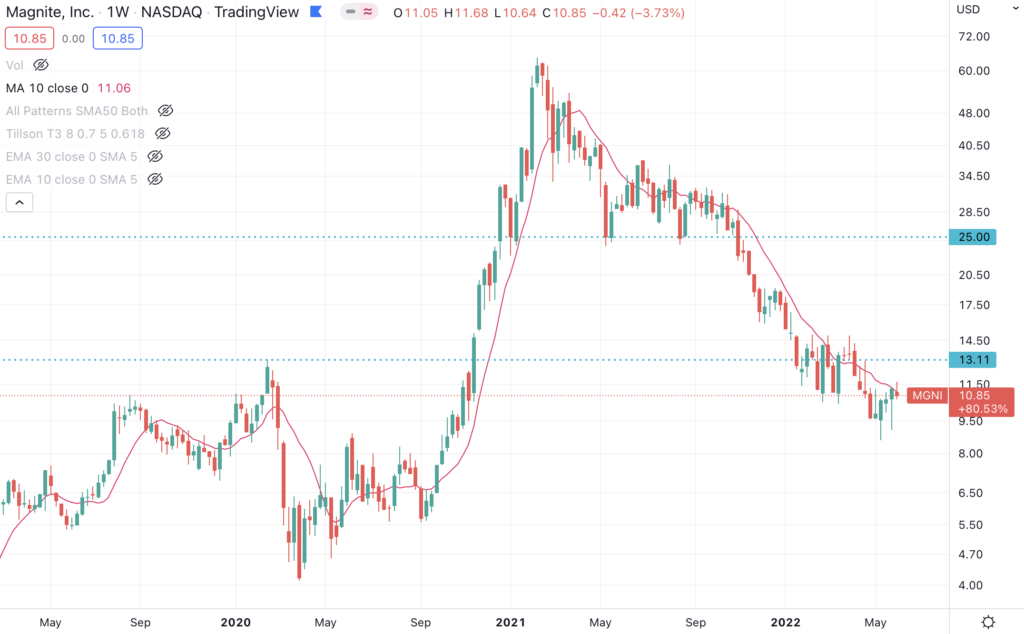
Once Magnite lost the 50-day (shown as 10 week above) moving average in February of 2021, price never really looked back.
Conversely, we see in May 2020 that once this moving average was reclaimed, price went on an epic bull run (after a few retests) that I rode along with.
We see a similar story with XPeng, albeit during a shorter timeline.
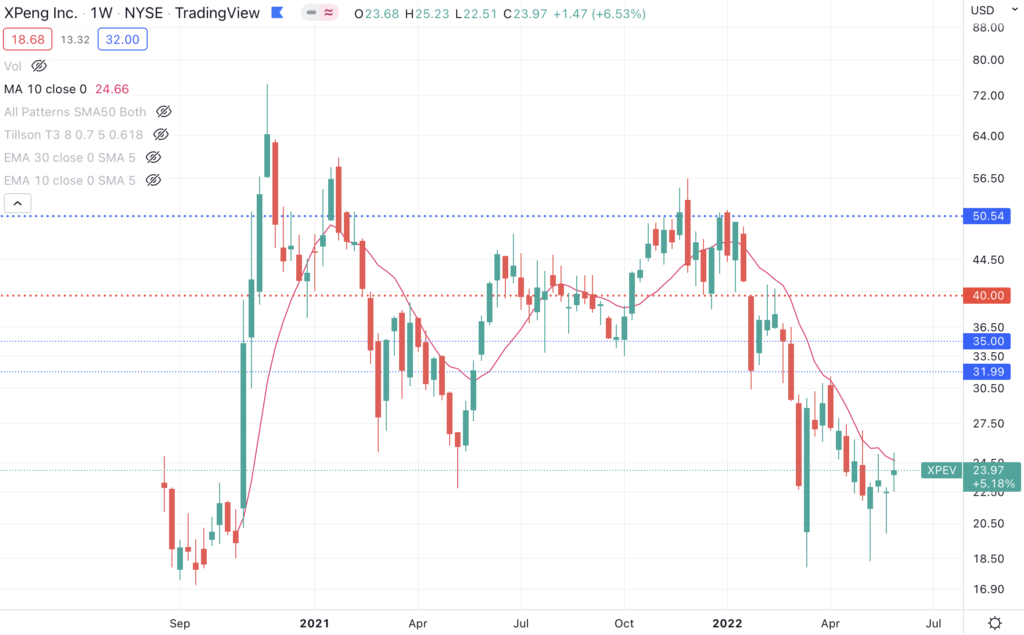
Simply put, Magnite & XPeng have struggled retaining the 50-day moving average, and we see how far price has declined since. Given the bullish signals in breadth, and my bullishness on the names, I took a shot on both, with tight stops just in case those moving averages were lost.
They unfortunately were, and I’m keeping an eye out for my next opportunity.
Add: AMD (AMD), +100%
AMD, on the other hand, is holding on much better. We see price is holding the 50-day moving average, with several accumulation days on strong volume.
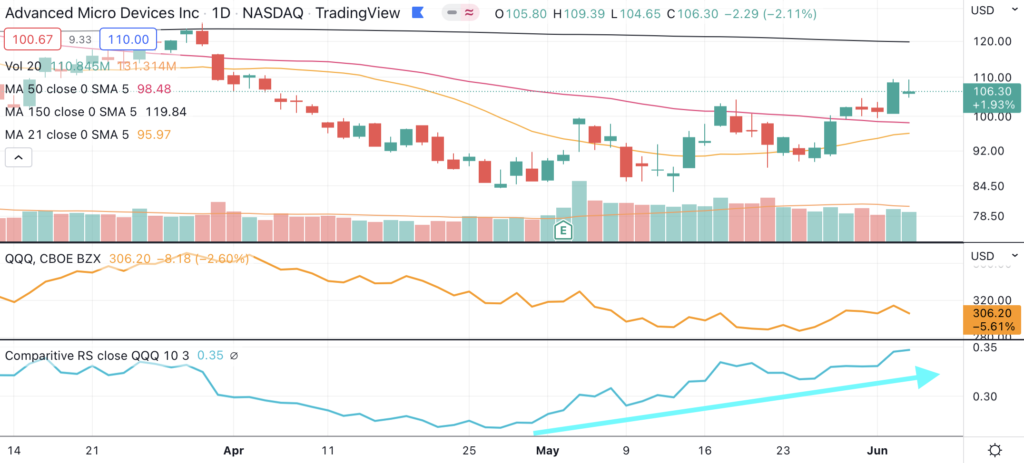
Even on Friday, where the Nasdaq fell 2.5%, AMD outperformed by falling only 2.1%.
Given this strength, and my general bullishness on AMD, I felt Thursday was a good time to build on this position.
Sell: Atomera (ATOM) and Distribution Now (DNOW)
Atomera, unfortunately, also did not hold the 50-day.
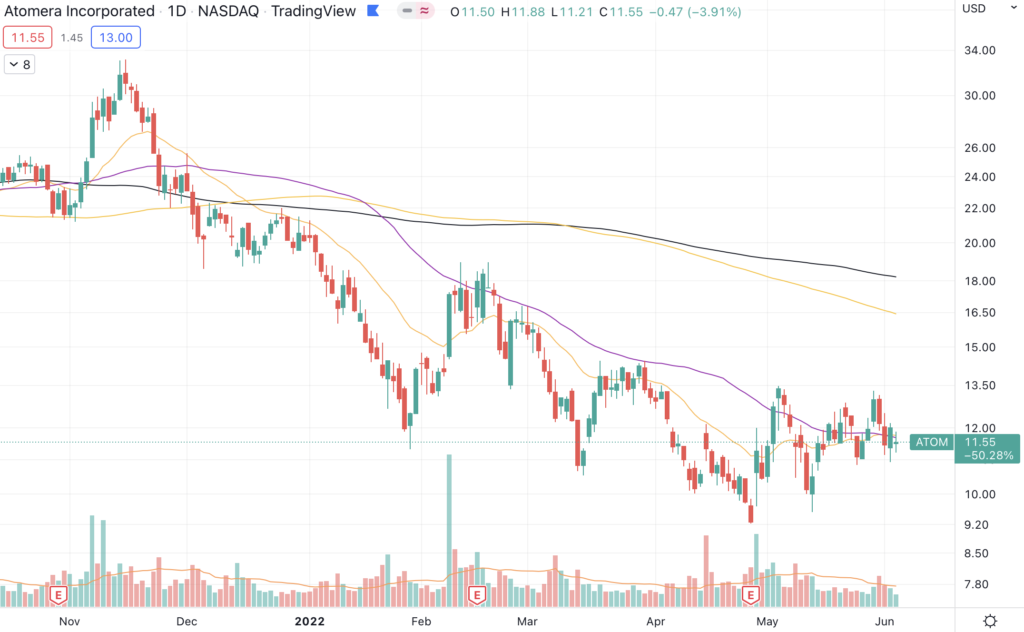
This is a highly speculative position, which explains why it was smaller than the other names I opened. Either way, while I really like the story of $ATOM, I’m not taking any chances given the overall market concerns. More ambitious investors could set a lower stop, but given how many times Atomera has failed the 50-day, I would rather wait for that level to be reclaimed. In the meantime, I’ll take a 5.7% loss.
Distribution Now actually closed out strong. It seemed like the momentum was turning down, but some buyers stepped in at the close.
I say “some” because the volume was still incredibly low. More concerning, though, is the fading momentum, as shown by the RSI.
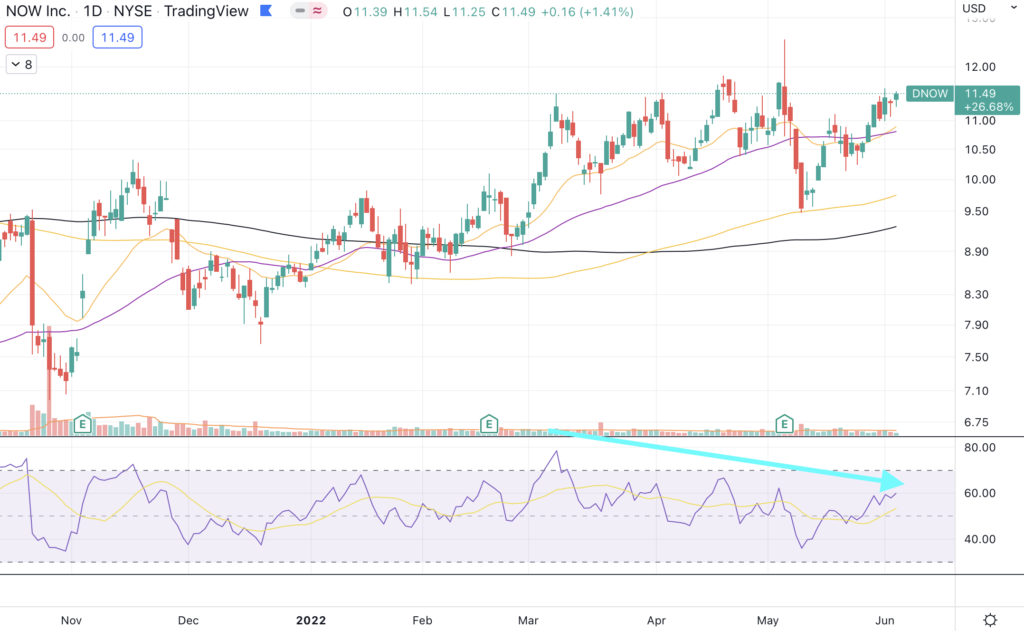
Notice how we’re seeing lower highs in RSI, while price keeps rising. This shows that demand is waning, which is a concern I have highlighted for energy in general.
Seasonally, oil should do well over the summer, so I’m keeping an eye on this sector. For now, I’ll take the 3.3% gain and will move on. I was hoping for a breakout, and it hasn’t happened yet.