Hey Everyone,
I hope you had a great week, let’s get into it.
Portfolio & Market Updates
My portfolio was basically a wash this week, which was well below the major indexes, S&P 500 (+1.8%), and Nasdaq 100 (+2.3%). Ark was down -1.9%, and small cap growth $IWO was down -1.6%.

Which means the week was a small caps vs large caps story. While some consolidation in small caps makes sense after last week’s big move, I still believe that small caps must outperform for a sustainable bull rally.
Speaking of bull rallies, the Nasdaq had more net highs than lows for every trading day last week.
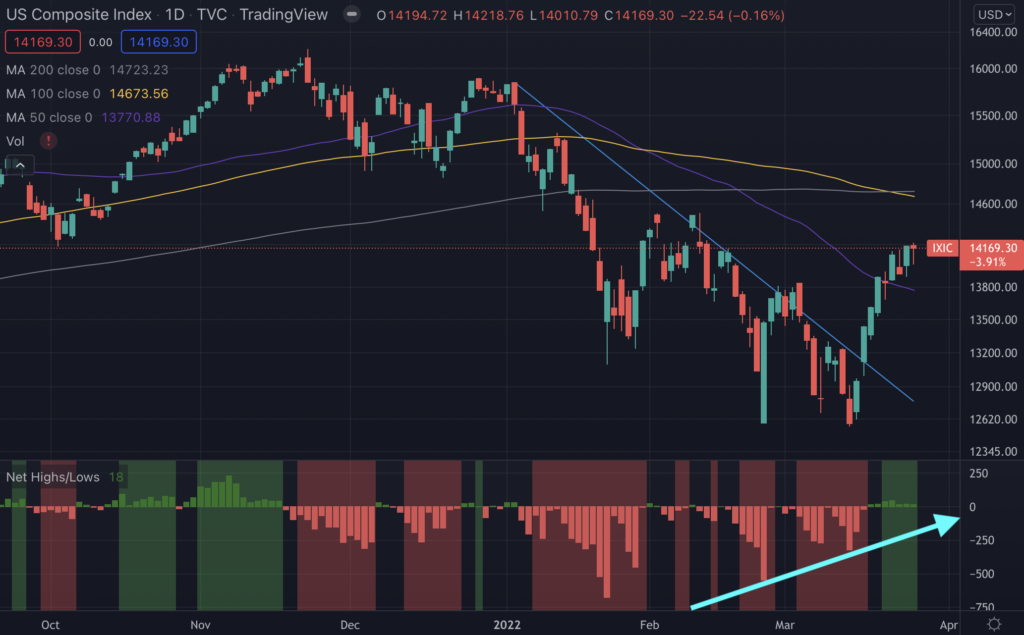
You may notice that the number of net highs are declining, but my specific focus is on this light blue arrow. So long as the (potential) net lows are above this blue trend arrow, I believe any net lows would be a healthy correction within a new uptrend.
In other words, I’m keeping an eye on fewer net lows during any potential consolidation. If that happens, I’ll keep looking for stocks to buy, not sell.
Williams %R Suggesting a Cooldown
Which I did not specify when I put my stops in place on Thursday, but was included in my small cap growth $IWO chart. Notice how the Williams %R of Datadog is overbought (purple section, right arrow).
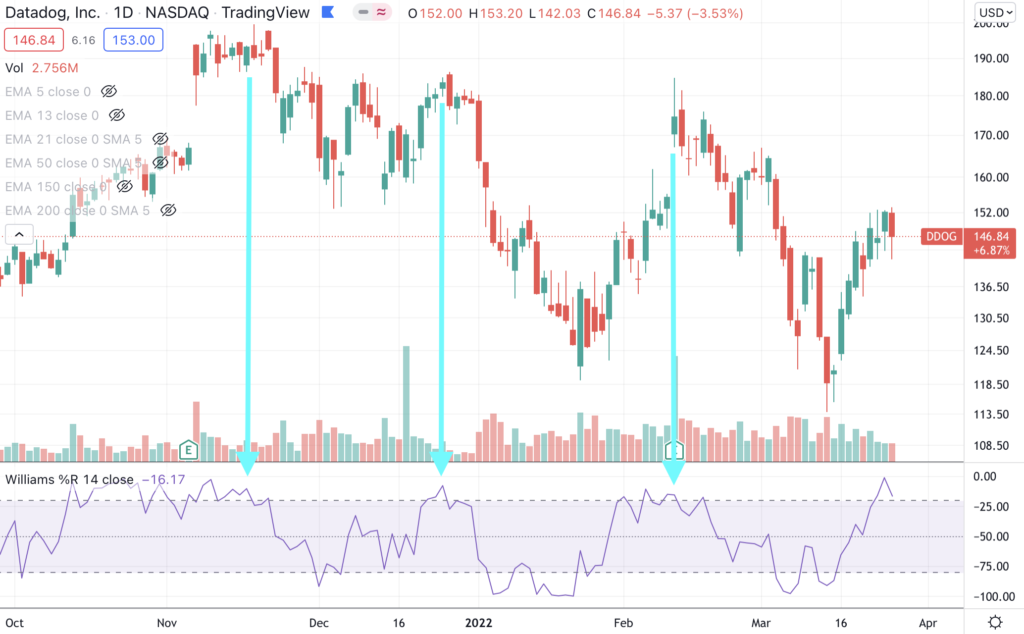
Notice what had also happened with price afterwards. In choppy markets, an overbought Williams%R can often signal a downturn is on the horizon. With Datadog, specifically, those drawdowns have been pretty intense.
You can safely assume that every other high growth tech chart looks the same, from SentinelOne to the Nasdaq 100. On top of this, we saw a massive swing in the percentage of bulls, according to the AAII.
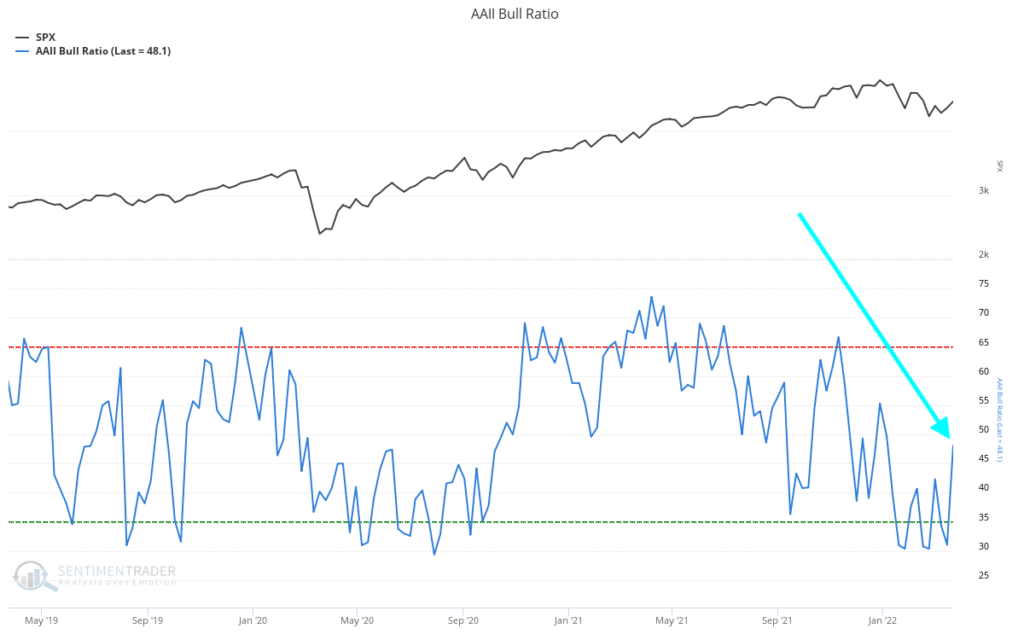
Couple this optimism with many companies and markets looking overheated, and I placed stops on my new positions.
Back to Williams %R, notice how I said that this strategy works in choppy markets. This is not an effective tool during bull markets. Let’s zoom out on Datadog’s big run after correcting last year.
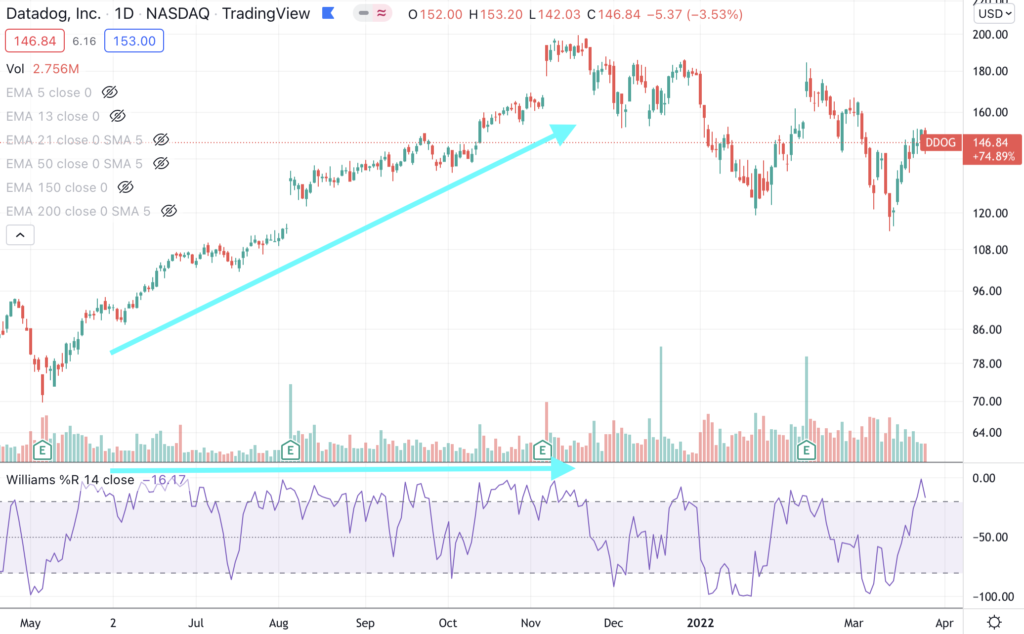
Notice how Datadog was basically always overbought while appreciating 130%. If we had the >90% upside day I have been waiting for, I would not lean on Williams %R as much as I am. Until that happens (or back to back >80% upside days), I will often use this tool for entry and exit points.
Yield Curve Concerns are Premature
The yield curve has been plummeting throughout the year, as I have been acknowledging, but I’m hearing more and more media raise this concern for the masses.
I last wrote about the dropping yield curve and an eventual drawdown on February 18th, and emphasized that equities generally appreciate for quite some time after the inversion.
Importantly, though, the S&P 500 was 2,925 when the yield curve inverted in august 2019, and rose to 3,338 before the COVID crash, which was a 15% gain over 6 months. While caution is needed once the yield curve inverts, the market should still have room to run.
SentimenTrader showed this is another fashion, as a percentage of total US treasury curves inverted.
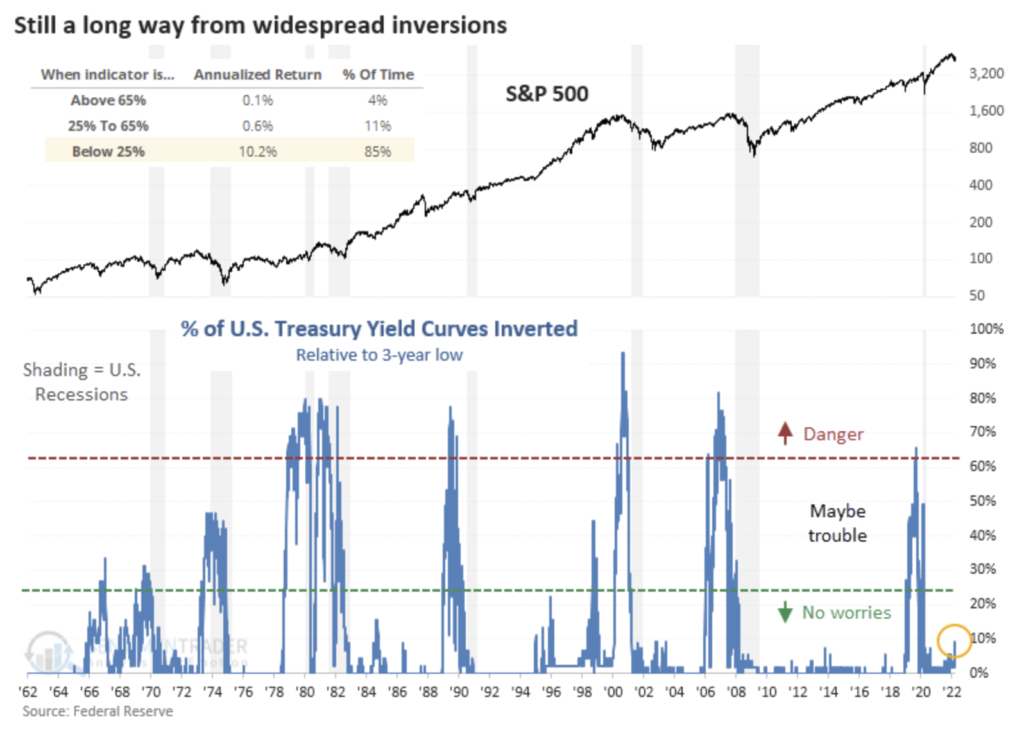
Notice how we’re at the yellow circle, which is well below the green “No worries” section. While there are other aspects of the market that do concern me, the yield curves has a long ways to go before we can blame them for the next major drawdown.
Market Trends
Which takes us to the market trends, and overall we see a continuation from last week. Longer term trends are still green for major indexes, China is still a mess, and bonds have been crushed.
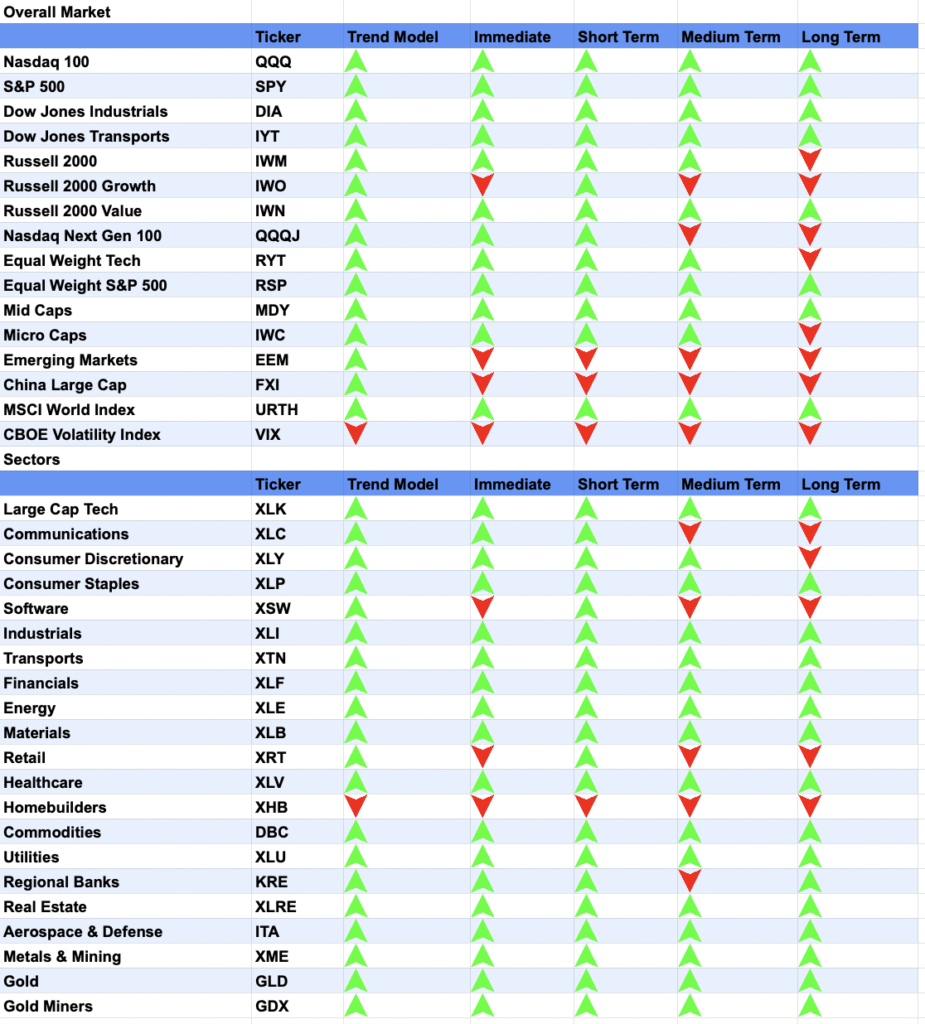
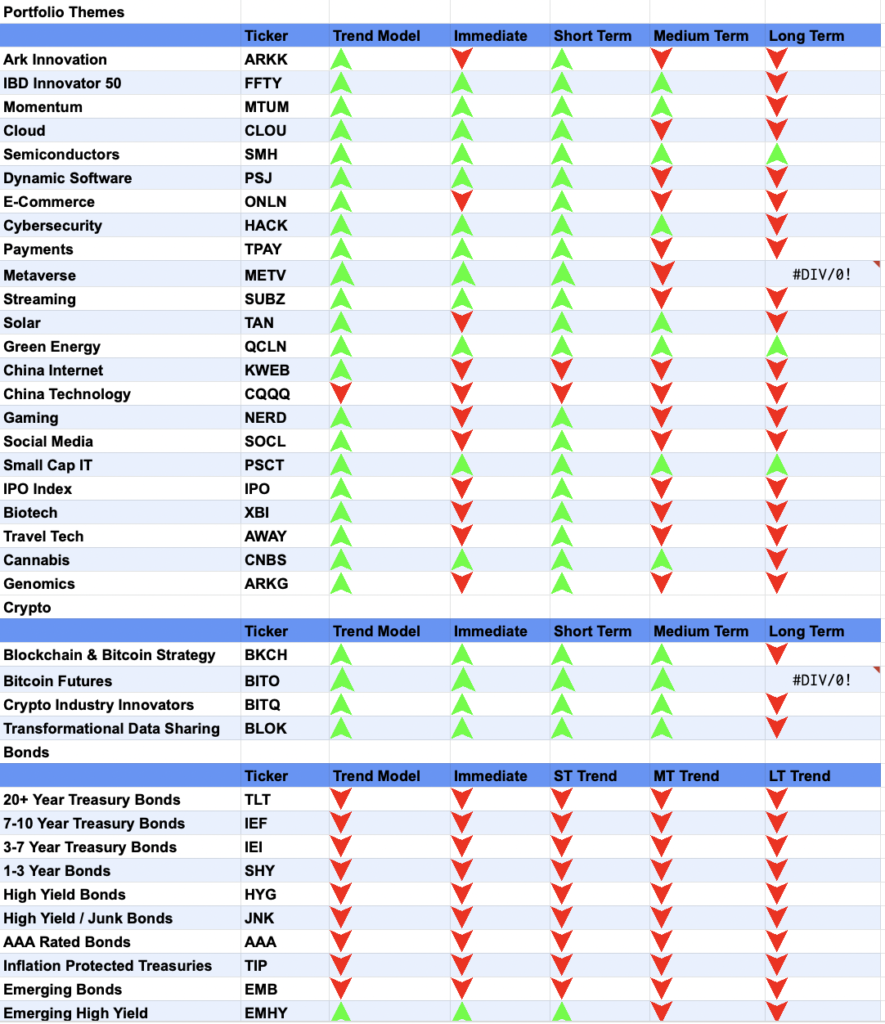
Looking at my themes, specifically, semiconductors reclaimed their long term trends, following along green energy.
I’m keeping my eye on them, and you can probably guess what I’m waiting for.
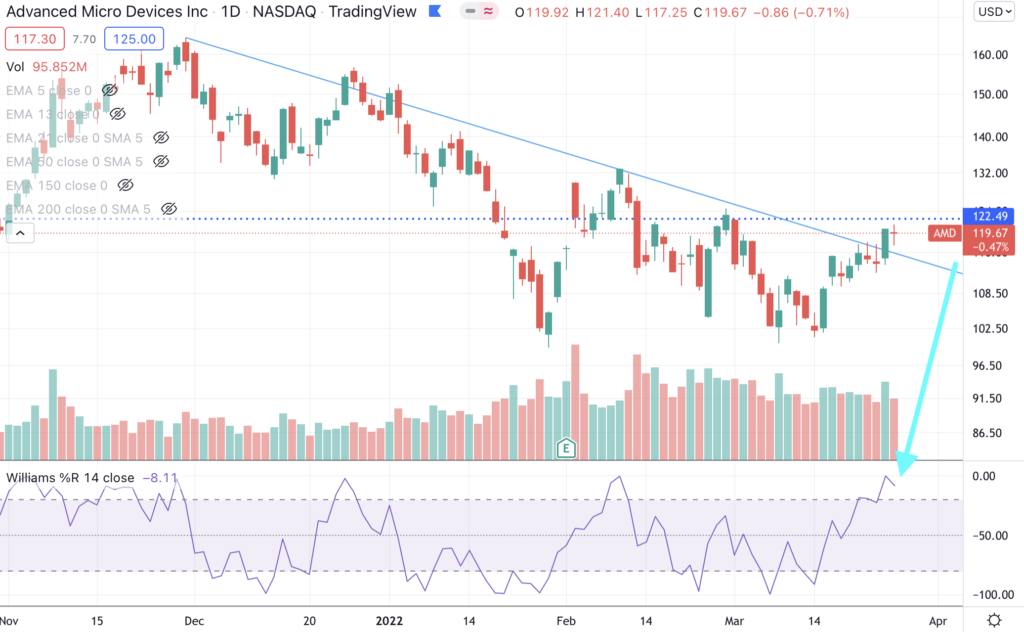
When I said that “you can safely assume that every other high growth tech chart looks the same”, here’s what I meant. AMD is breaking out of this downtrend which started in December, and once their Williams %R slows down, we’ll see how price sticks the landing.
Overall, we’re seeing constructive price action under the hood, with many markets running hot over the short term. Since we have not seen investor demand return via 90% upside days, I’m staying defensive just in case we get another leg down.
Sell (Stopped Out): SentinelOne (S) & Datadog (DDOG)
While I’m incredibly bullish on these names, I showed with Datadog above that certain indicators were at levels that previously flagged big drawdowns. Given this, I placed protective stops on both of my new positions, and cashed out with a 1% gain in Datadog and 8% gain in SentinelOne. In doing so, I can quickly buy in both without waiting for the 30-day washout rule.
While Datadog was put in a place where my profits were locked in, I explained that SentinelOne’s stop was just below former lows at $40.88.
Check out this 5-minute chart, and notice how many other eyes were on this level. Price not only immediately fell once breaching this level (left arrow), it then collapsed after a failed retest (right arrow).
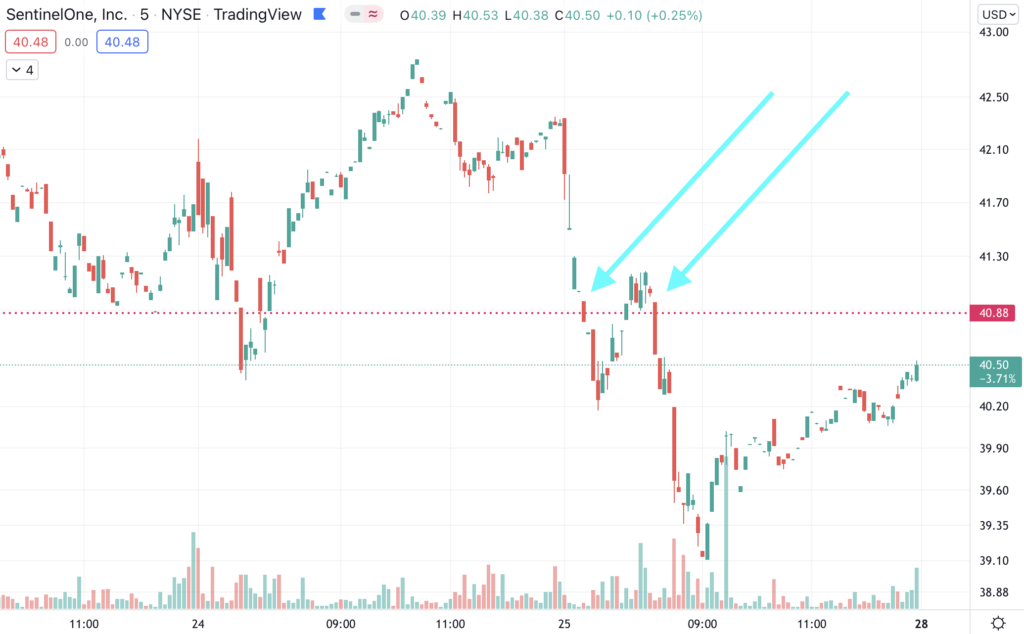
This may sound obvious, but higher highs and higher lows are indicative of uptrends. If a lower low or lower high occurs, you’ll likely see many traders and algorithms selling out at these levels. Therefore, these prices can be quite helpful at minimizing your downside risk while ensuring you don’t lose out on an extended uptrend.