Hey everyone,
I hope you had a great week, let’s get into it.
Portfolio & Market Updates
My portfolio was up 2.6% this week, which was not great compared to the S&P 500 (+1.9%), and Nasdaq 100 (+4.7%). Ark was up (13.7%), while small cap growth $IWO was up (3.9%).

We can mostly thank the underperformance to my ~40% cash position. Although we are seeing encouraging data points in the market, we’re also seeing significant volatility, which is why I’m taking a measured approach while reentering this market.
The Nasdaq is making a higher high, and is parked right below the 50-day moving average.
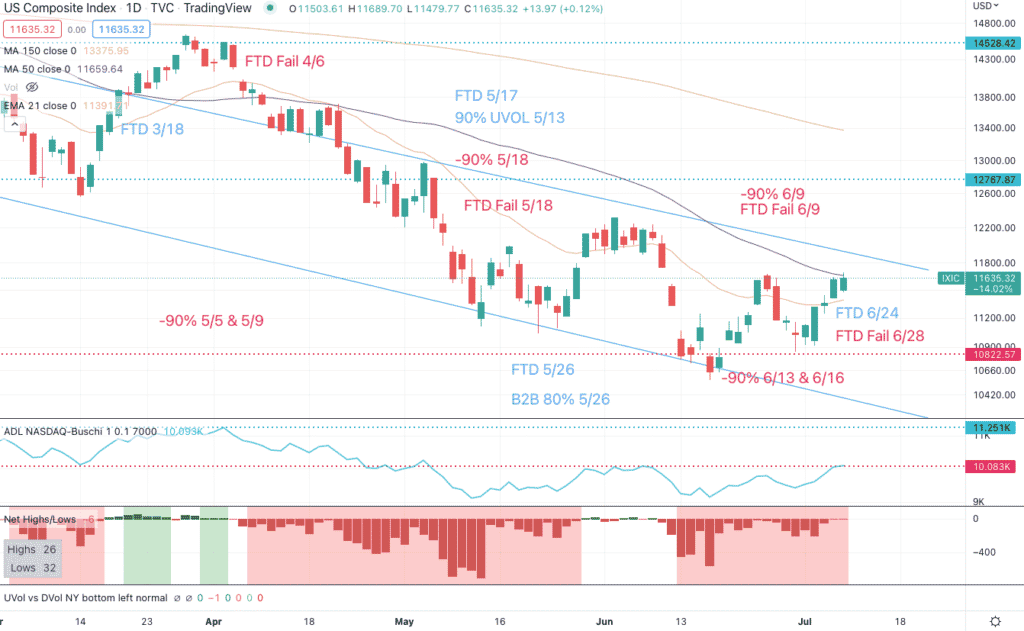
This has been a concerning level in the past, and you can see what happened in April when that moving average could not be reclaimed. With >80% of shares traded algorithmically, we can safely assume that many sell below this level.
We also see that bears still have the ball. The June 24th follow-through day that failed on June 28th, and there have been 90% downside days on June 13th and 16th. On top of that, the Nasdaq has more net lows than net highs for 19 straight trading days.
So why am I buying stocks? Well, there are some encouraging data points.
- The Nasdaq & S&P 500 have each had only 1 distribution day since the June 24th follow-through day
- The Nasdaq is making fewer and fewer net lows (as shown above)
- The Nasdaq generals have already cleared the 50-day moving average (more on that below)
- The first losers mentioned last week (China, biotech, and small cap tech) are still leading
Simply put, if we get a resumed follow-through day with the Nasdaq & S&P 500 reclaiming their 50-day moving averages, the bulls are in control again. Although my bias is still towards a bear market rally, I plan on monetizing this run up, however long it lasts, and would love to be proven wrong with a new bull market.
Until then, I’m buying positions that are in the strongest sectors (China, biotech, and small cap tech) with the best looking charts. If the bulls take control, expect a flurry of buying, similar to what was telegraphed on my October 15th, 2021 summary.
Are The Generals Guiding the Nasdaq?
I mentioned above that the Nasdaq generals have already cleared the 50-day moving average. Those generals, of course, are: Microsoft, Google, Amazon, and Apple.
While the Nasdaq & Nasdaq 100 (which focuses on bigger tech) are below this key moving average, the generals cleared it 2-3 days ago, for the first time since March.
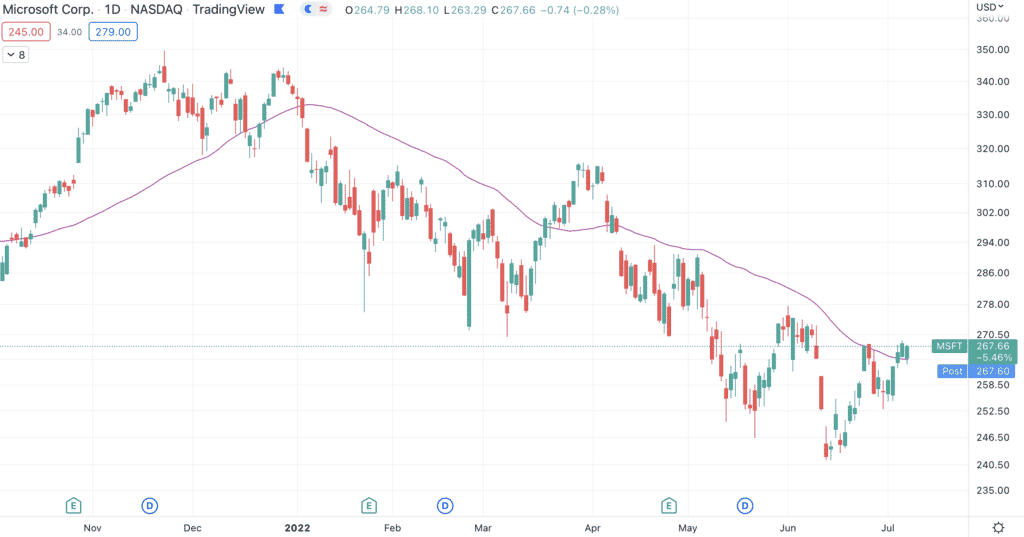
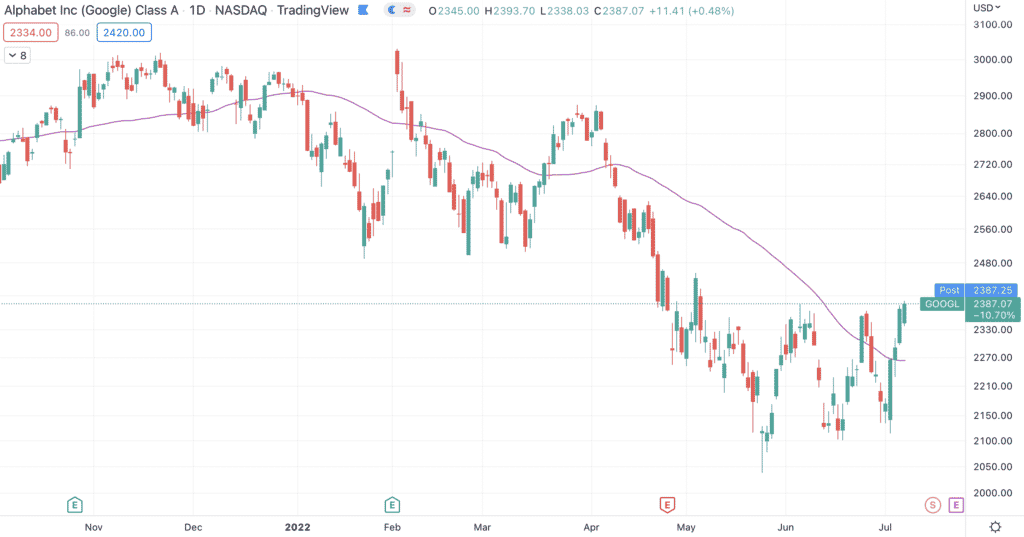
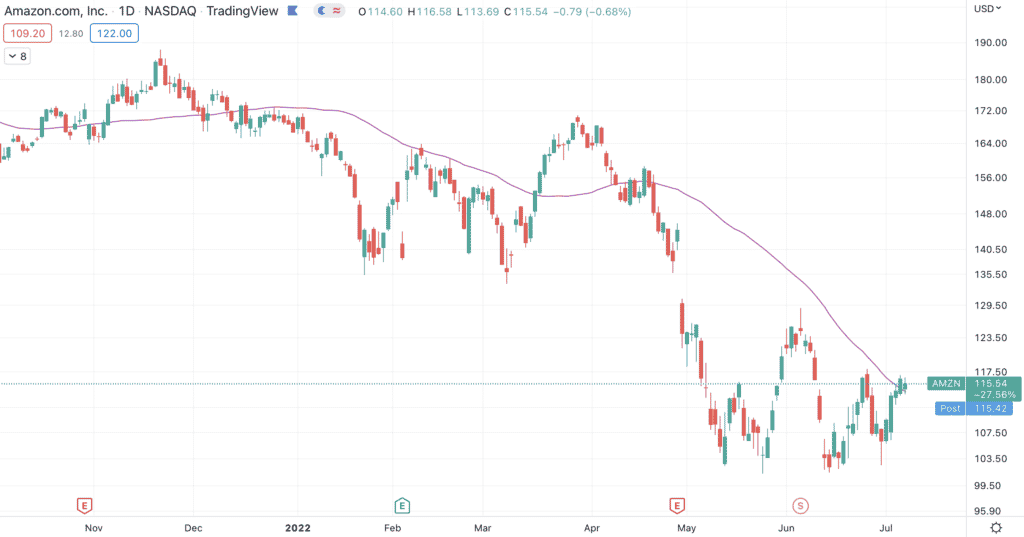
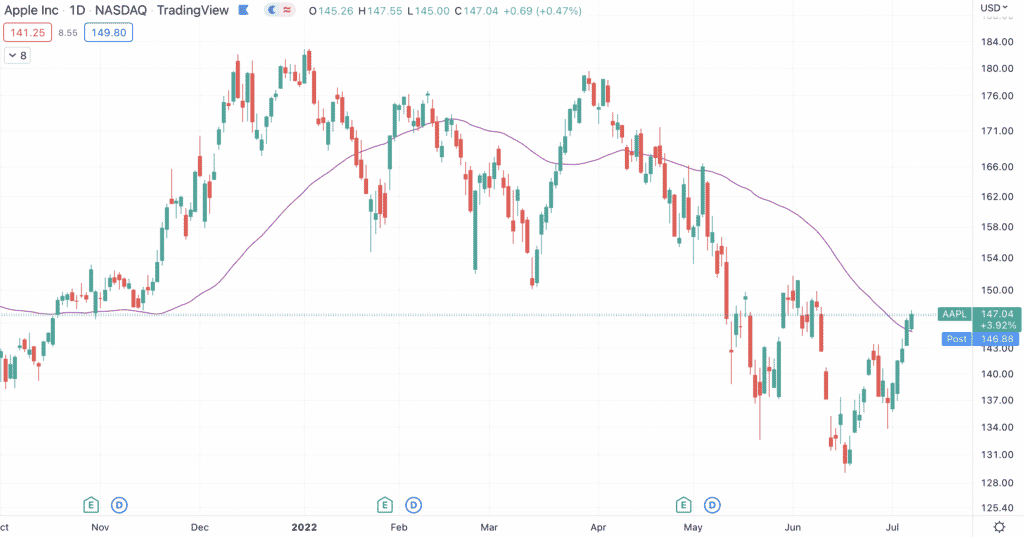
As we can see from March, this does not guarantee a new bull market. While I’m not expecting one, you see in March that they and the market had a decent run before the next leg down.
So why aren’t I buying these generals? I believe these names are obvious, they have lower upside (as their market caps are in the trillions already). More importantly though, the generals made lower lows in June.
You’ll notice that Google is the exception, as their lower low was in late May. Fair enough, let’s compare the strongest general, Google, to Ark.
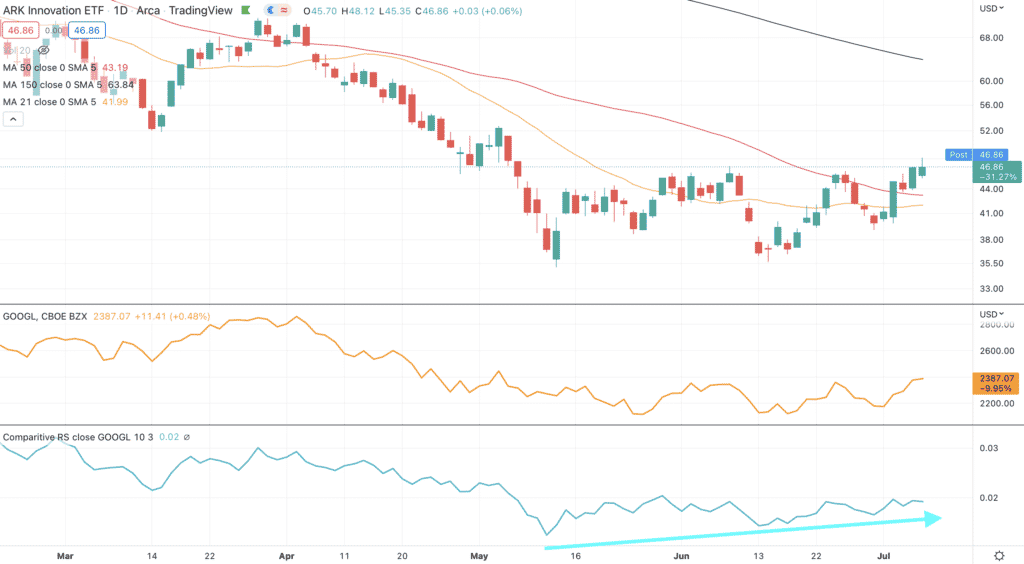
As you can see from that light blue arrow, Ark has been outperforming Google since mid-May. In other words, while money is moving to generals like Google, more money is moving into small cap tech, biotech, and China.
Thus, I’m staying focused on these sectors. My most bullish names are close to breakouts, namely Datadog, SentinelOne, and Palantir (more on that below). In the meantime, I’ll park money in names with better looking charts.
Crypto No Longer Dropping After Bad News
Here are some negative news events revolving around crypto over the past couple of months, what stands out here?
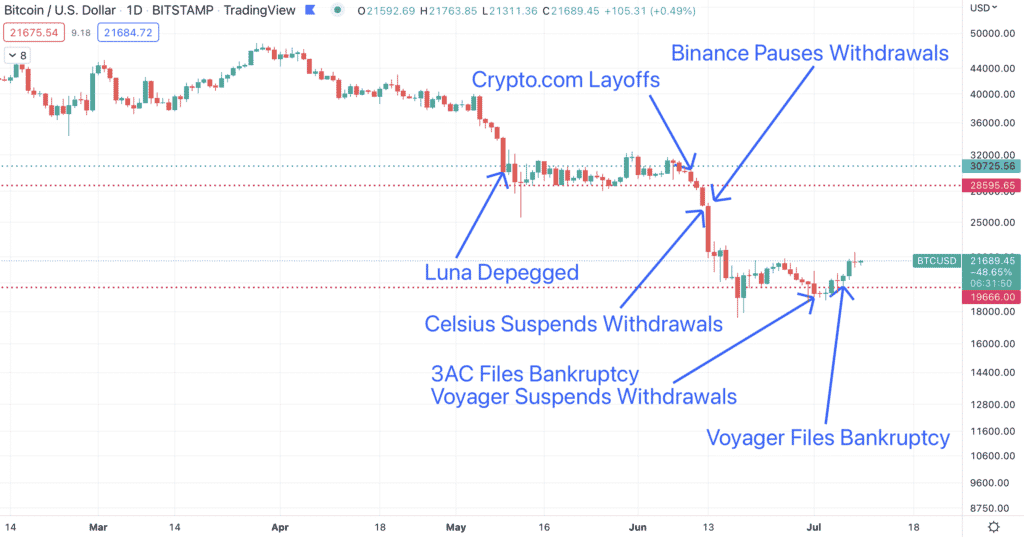
I’m sure there have been more events, and the title gives away the answer. Notice how on the day Voyager filed for bankruptcy, Bitcoin went up by 1.9%.
Before that on July 1st, Three Arrows Capital (3AC) filed for bankruptcy, and Voyager suspended withdrawals. Despite such concerning news, Bitcoin only dropped 3.4%. According to the eye test, the drops seem less severe from May to July, and ultimately price appreciated from bad news after Voyager’s bankruptcy.
Such reactions after bad news often signal market bottoms. This observation, coupled with the extreme fear in crypto I cited last week, is why I am opening positions in this space.
Checklist for Crypto Bottoming
Whether bullish or bearish, I hope most agree that crypto is incredibly speculative, and ridiculously volatile.
Due to this, there’s no need for bottom fishing, as you will be just fine if you ride a trend up. Conversely, however, you could get wrecked if you catch a falling knife. Anybody who bought in early June, after Bitcoin dropped 55% from November highs, is down another 30%.
Now, it’s impossible perfectly calling bottoms in Bitcoin. When we zoom out on the weekly chart, though, we can see common things happen before the next uptrend begins:
- Weekly RSI hits oversold (low purple box, currently most oversold since 2011)
- 200 week moving average (black line) must be reclaimed
- Wavelength chart (courtesy of LazyBear) must be coiling up and overtaking the lower green line (blue arrows citing lower red/green box)
- MACD histogram must start turning up, if you wait for the cross, you’re too late (blue arrows citing higher red/blue lines)
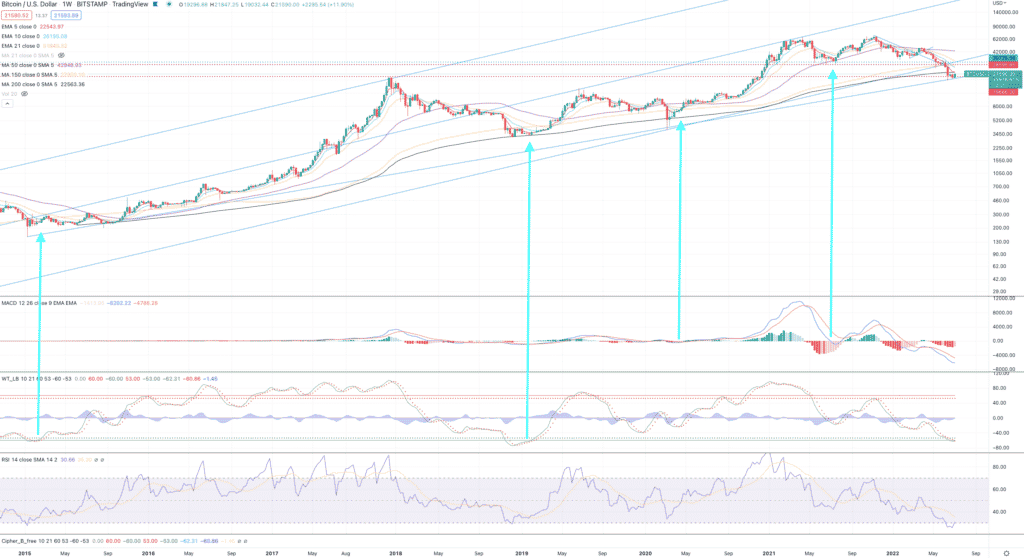
Feel free to validate these bullet points by inverting them. What happens above when:
- Weekly RSI hits overbought
- 200 week moving average is lost (this correction is the first time that has occurred, perhaps using shorter term moving averages like the 50-week in purple will help)
- Wavelength chart is coiling down and falling below the red line
- MACD histogram starts turning down
As you can see, this isn’t a bad method for identifying tops either.
Back to where we are on the checklist today. Currently, only the first box is checked, as the weekly RSI hit the most oversold since 2011.
If more of these boxes get checked, I’ll likely increase my crypto exposure along with it. As you can see from the chart above, this method likely won’t buy at the exact bottom, but it gets pretty close.
Market Trends
Which takes us to market trends, and many themes have joined China and biotech. Solar’s long term trend, in fact, is the first that turned up this week.
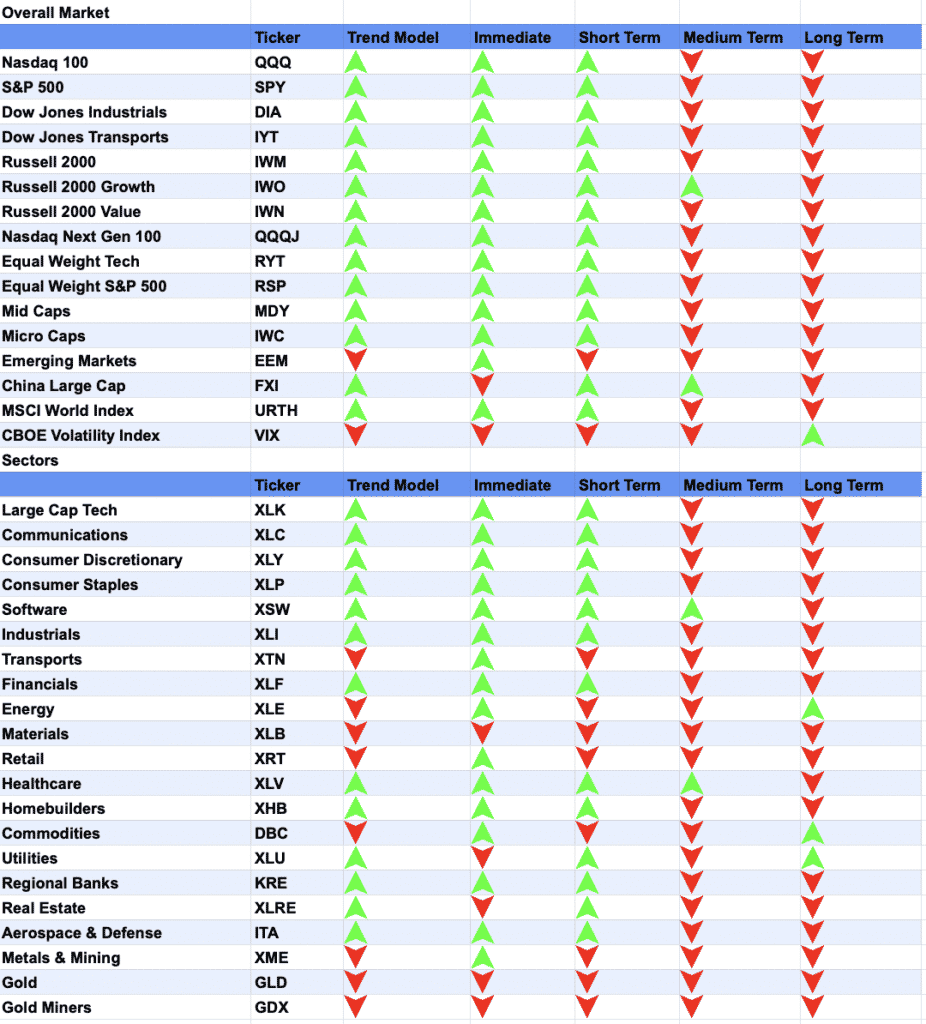
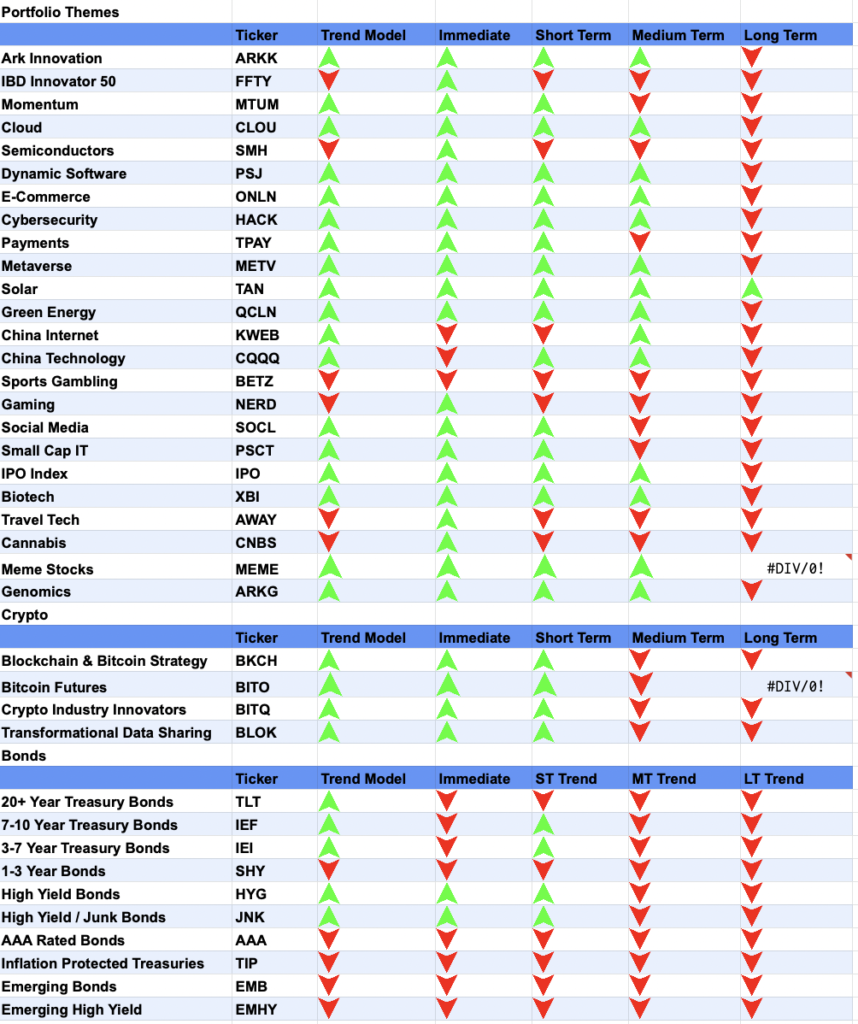
We are also seeing a bid in junk bonds, which is a helpful gauge for risk appetite. If junk bond prices improve, then their yields are declining, meaning the market is viewing this group as less risky (as they’re requiring a lower yield for holding them).
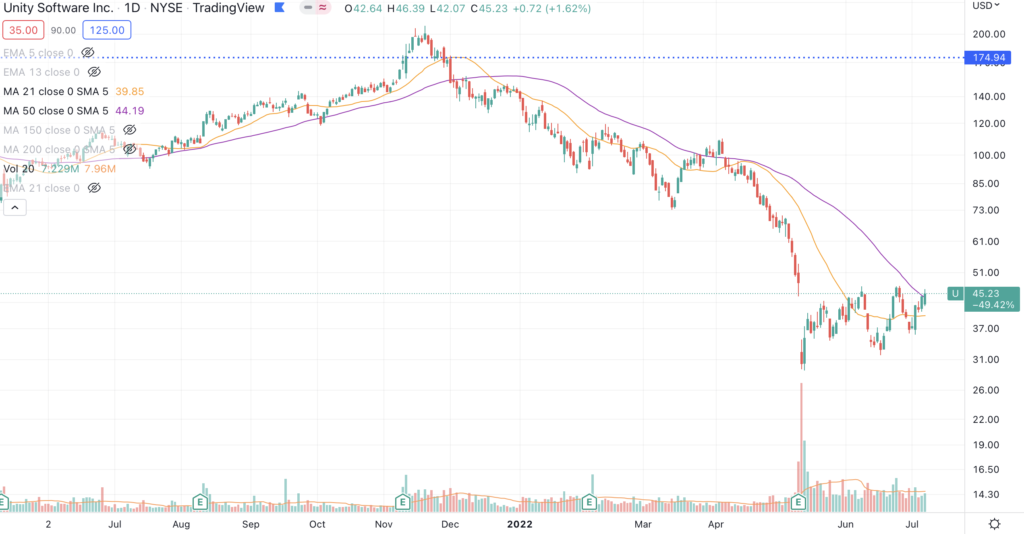
The metaverse theme turned up, and we see that both Roblox & Unity are looking interesting.
Roblox is one of the best looking charts at the moment. Notice how price broke out and successfully retested the 50-day (purple), and the 21-day EMA recently cut above the 50-day. Finally, the accumulation volume since their May 10th earnings is unquestionable.
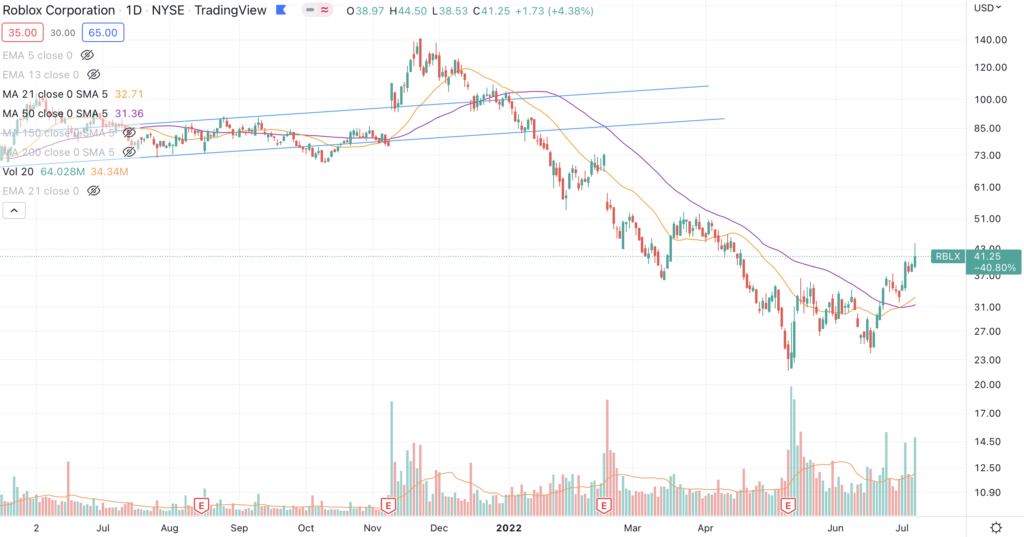
This is one of the top names on my radar, and in highsight I clearly should have bought them during the retest.
Unity, on the other hand, may offer a second chance. Price just broke through the declining 50-day on Friday. We have often seen retests when the 50-day is declining, as we did with Roblox. This name is on watch for that opportunity.
In order for any sustainable rally, the semiconductors must also join in, and they’re still behind. If this turns up, we may have more than a bear rally in front of us.
Highest Conviction Names Are Close
While trends are turning up on many of my highest conviction names, I feel like the entry risk is not yet worth the potential reward. Price is trading so close to prior failure areas, I would rather sacrifice a couple percentage points of gain for a breakout before buying into a drawdown.
SentinelOne, my favorite cybersecurity company, shows this first hand.
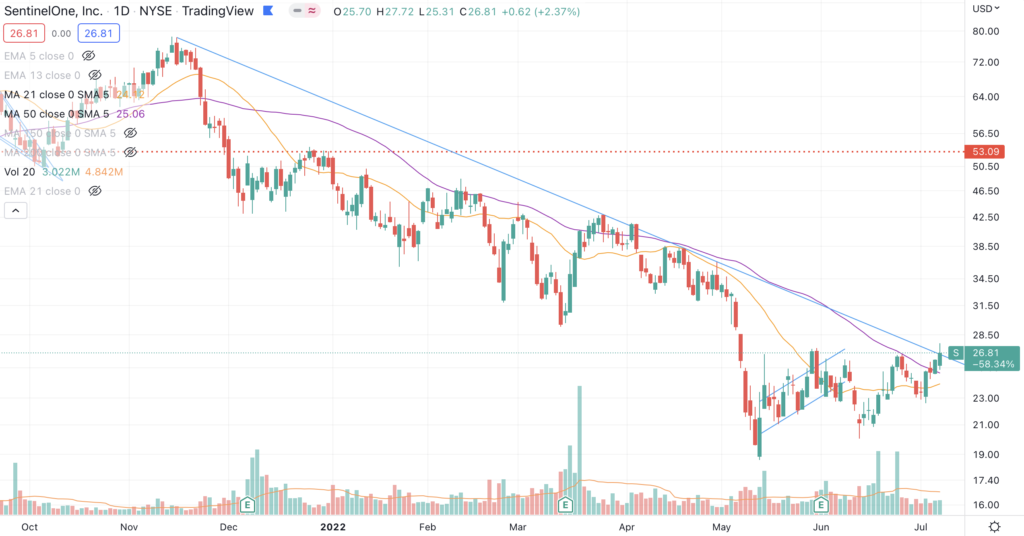
Notice that price cleared the 50-day (purple), and notice that it immediately sold off at a level where it has failed 6 prior times.
Palantir, one of my favorite data plays, looks pretty similar.
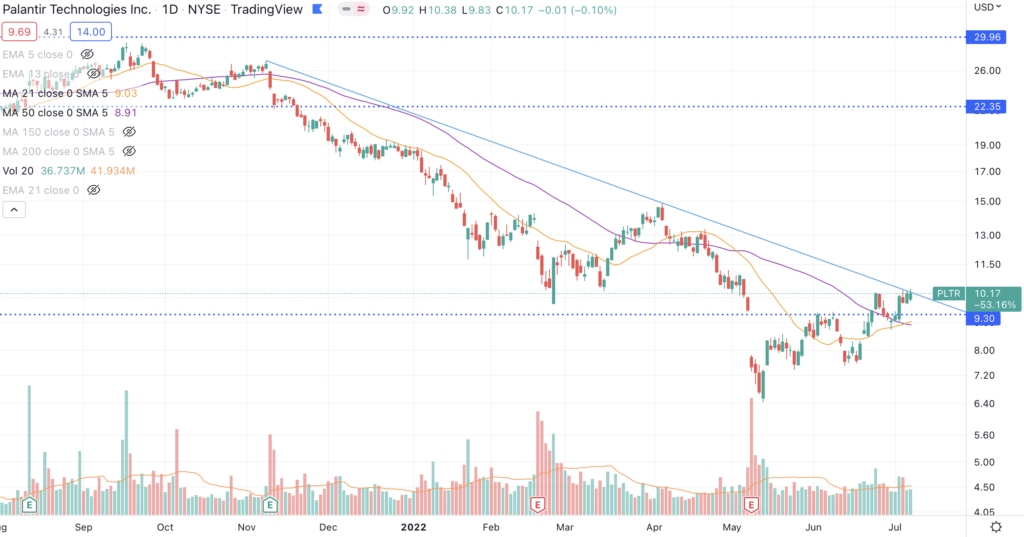
The 21-day EMA crossing above the 50-day is bullish, but April is proof that this does not automatically start a new bullish run. I would rather wait for price to breach this downtrend.
Roku, one of two names that I held during this drawdown, is even more precarious. Notice that there is a shorter downtrend that it has traded in since late March, AND a longer term downtrend since it topped in August 2021.

Even more precarious is that price has breached this longer term downtrend several times, drawing investors in, and then breaking down afterwards.
Finally we have my favorite company, Datadog. I was shaken out of this once price fell below the 50-day a couple weeks ago, and it has since rebounded to prior levels.

Notice that this company also has a downtrend in front of them.
Could now be the time that all of these companies break out of their long term downtrends? Certainly, but I would rather wait until that happens. We could have made the same argument earlier this year, and anybody who bought and held then has realized substantial drawdowns.
New Position: Marathon Digital (MARA), 2.5%
This has already been a nice winner, up 33% over 2 days.
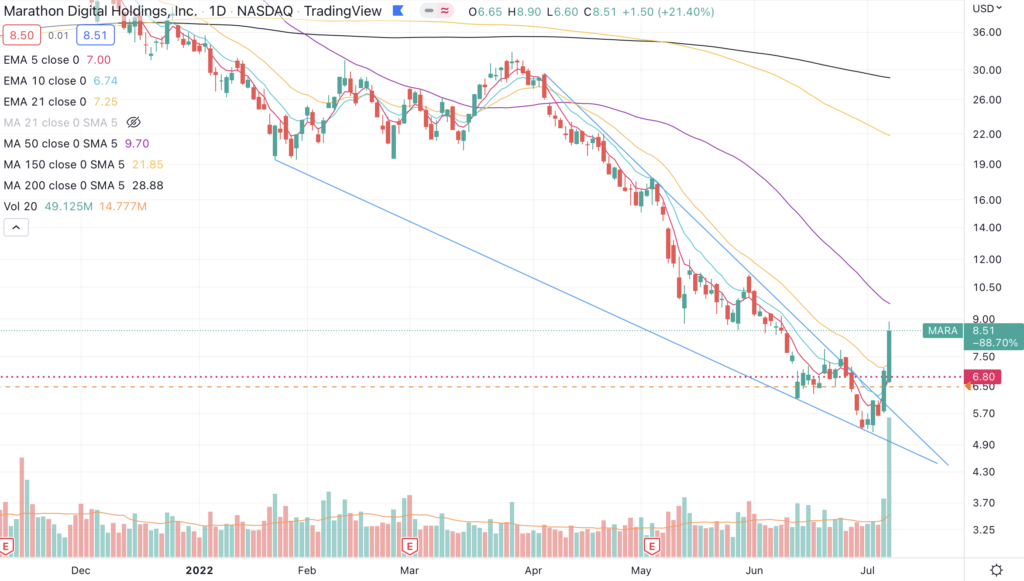
Price broke out of this wedge I was tracking, and hasn’t looked back since. I put this on your radar on June 24th, with the assumption that this would rocket if a breakout happened.
This would have been a much larger position if we were in a bull market, but my bias is still towards bears being in control. Due to this, I’ll happily take lower risk and capitalize on any gains that happen.
Once again, this is a highly levered bet on Bitcoin, as they are currently losing money on each Bitcoin they mine. Due to this, I consider Marathon as a rental, similar to any crypto exposure I have had in the past.
New Position: Futu Holdings (FUTU), 3%
I made a bet on this company last summer, and sold out for a double digit gain before price broke down 90%. Known as the “Robinhood of China”, $FUTU is riding the wave of Chinese citizens entering the stock market.
That wave evaporated as the Chinese cracked down on tech companies, which cratered valuations. Futu followed down with the market, and with the rest of Chinese tech, started outperforming the US market in mid-March.
This is another name that I wish I would have bought sooner in hindsight. I felt Pinduoduo was the safer name back then, and their 30% gain reflects that I didn’t totally miss this run.
I opened Futu’s position on Thursday, as this looked like a decent opening level.
Notice how Futu found buyers at Feb 2022 highs of $50.86 (red dotted line), the RSI took a breather back to levels before their breakout (upper blue arrow), and volatility is declining along with price (lower blue arrow). Declining volatility with declining price hints that investors are taking a breather for a potential breakout, and is a critical feature in Mark Minerviri’s VCP.
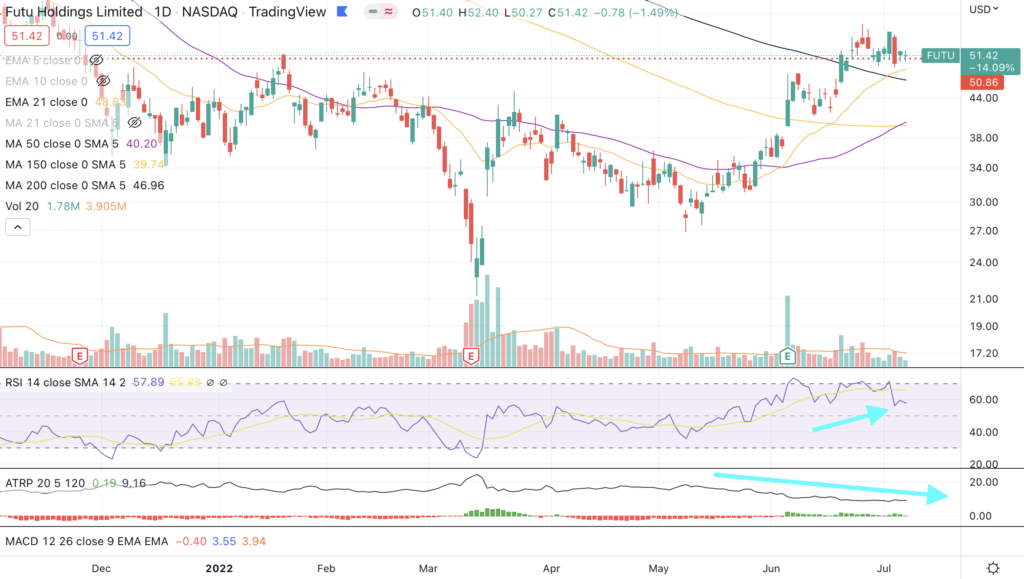
I plan on holding this so long as price stays above the 200-day moving average (black line). Since the 200-day is around $47, that’s around 8% risk, which I believe will be well worth the potential upside.
Buy: Kingsoft Cloud (KC) +50%
Similar to Futu, Kingsoft’s volatility has been declining during this consolidation.
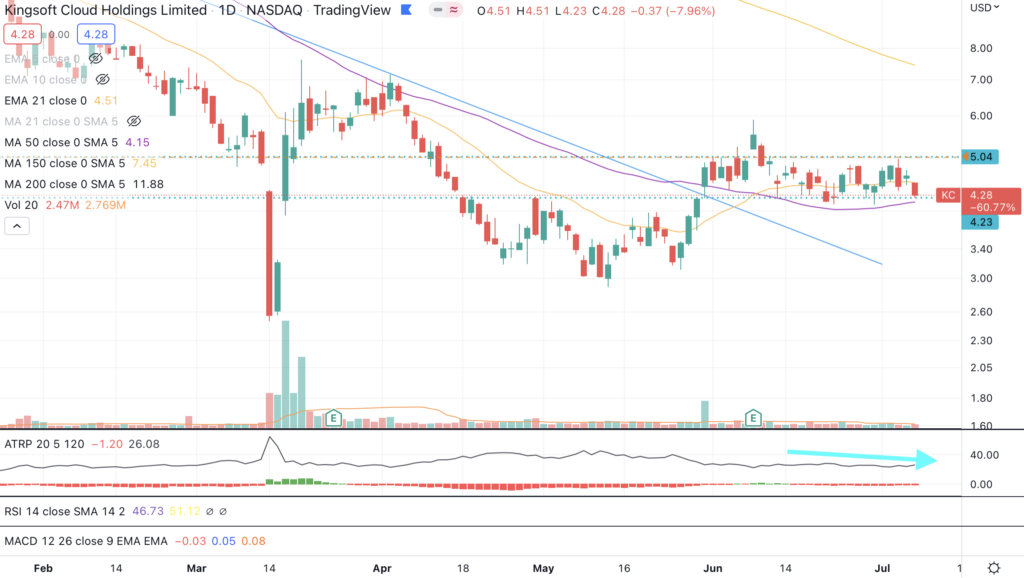
Add on top of that a rising 50-day moving average, and I added once price reclaimed the 21-day EMA. Price fell 8% on Friday, but you’ll see that this volume is well below the 20-day moving average, and price is resting above the rising 50-day (purple).
This company has the benefit of the doubt so long as price is above the rising 50-day. Given how much earlier China is in the public cloud compared to the USA, I believe this company could be worth exponentially more than $1 billion in the future. Remember, this is valued at 0.69x sales, while Snowflake is valued at 34.5x sales, and $KC has the bigger TAM.