Hey everyone,
I hope you had a great week, let’s get into it.
Portfolio & Market Updates
My portfolio fell -4.8% this week, which was well below the S&P 500 (+4.3%), and Nasdaq 100 (+4.5%). Ark was down (-2.4%), while small cap growth $IWO was up (+4.3%).

My portfolio was down for the same reason Ark was – our high Roku allocations. This name, along with Twilio, is exactly why I created and adopted to a trend following approach last fall.
I’ll expand on Roku later, as well as the general advertising market. Needless to say, I believe this advertising depression is creating an excellent long term investing opportunity.
The general market is looking a lot healthier. We see the Nasdaq 100 has broken above the upper end of the channel it has been trending in since November, which could signal the end of their downtrend.
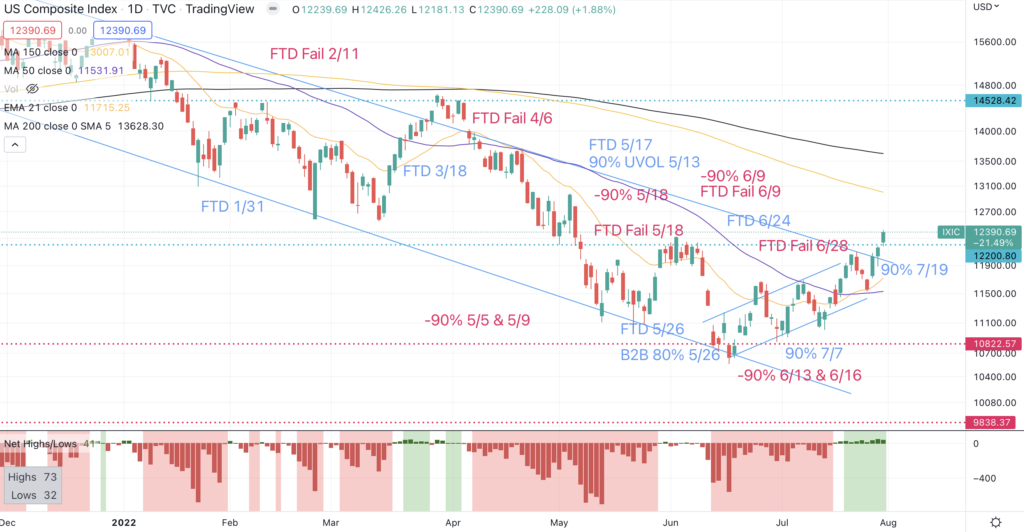
I say “could”, because anything is possible, but I don’t believe the downtrend is over.
The S&P 500 chart shows what I’m targeting for an intermittent high in the blue box below.
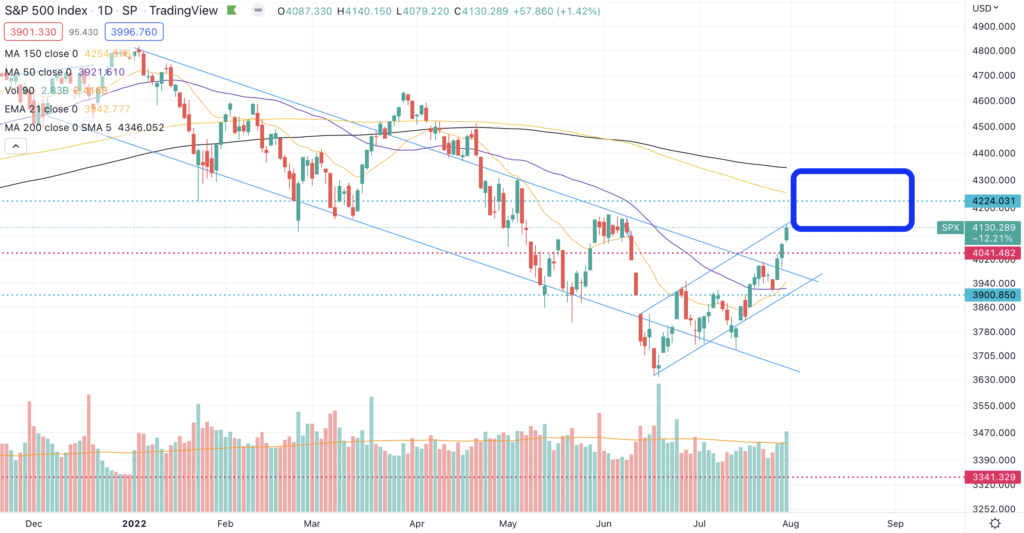
I’ll explain why I’m leaning towards an intermittent top coming within the next two weeks. I’m certainly bullish longer term, but as I have said before, bottoming is a process.
Longer Term Optimism, Shorter Term Concerns
Before writing about my short term concerns, another encouraging theme emerged for longer term bulls – breadth is returning.
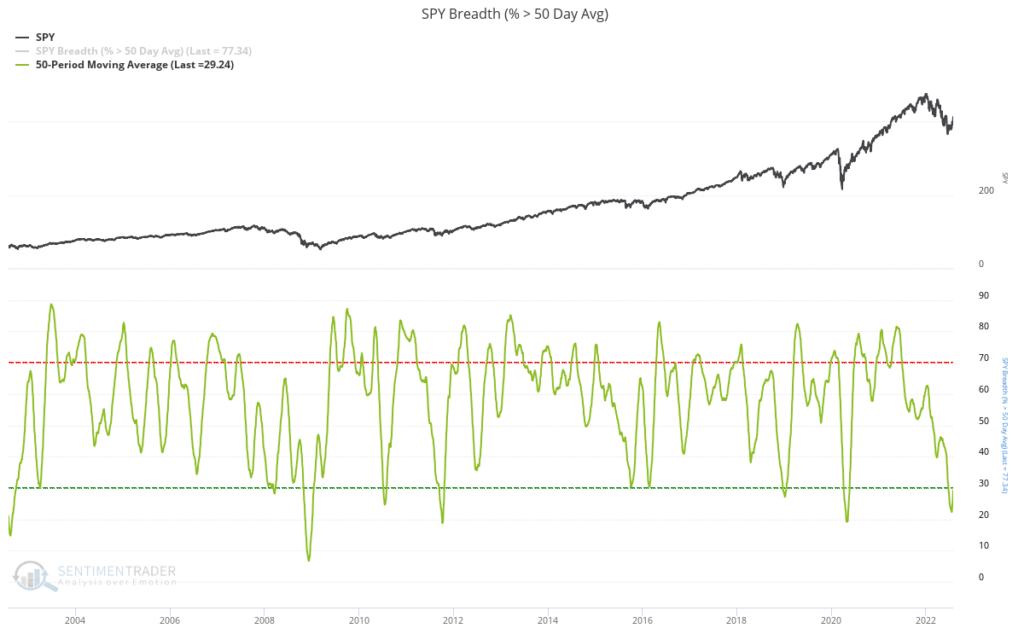
Starting with the S&P 500 $SPY, here is the 50-week moving average of stocks above their 50-day moving average (green line). Notice that breath had been washed out, and is now rebounding.
The Nasdaq 100 $QQQ looks even more compelling, which makes sense as they have fallen further than the S&P 500. Notice how $QQQ breadth is rebounding out of their second washout this year.
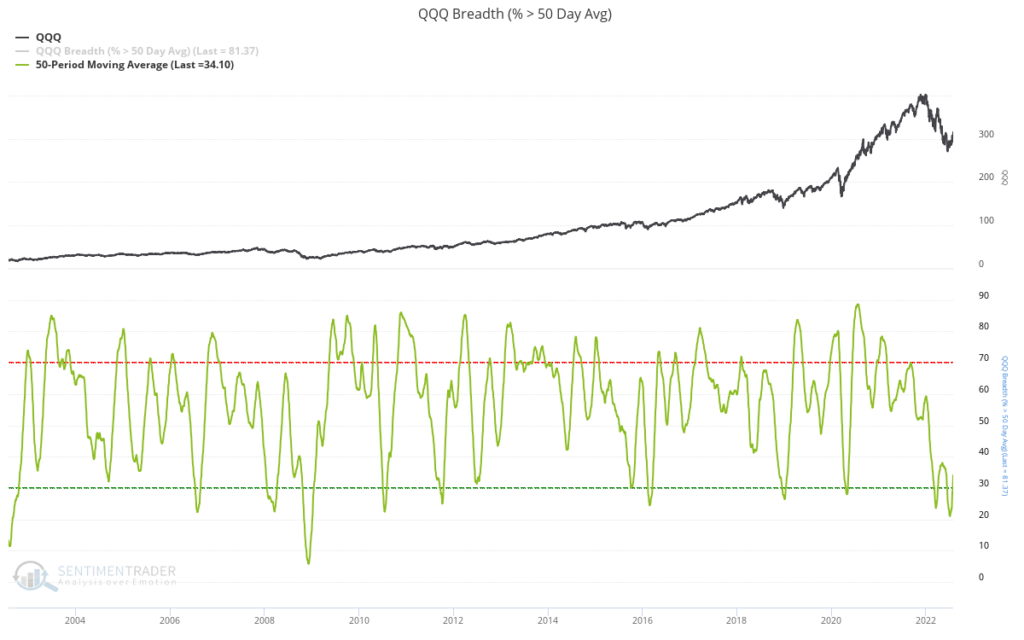
Quite often, these washouts occurr near the bottom, but not necessarily at the bottom. Unfortunately, I believe another short term drawdown is coming, due to:
- Retail optimism returning
- Seasonality
- The 200-day moving average being a lid
Retail Optimism Returned
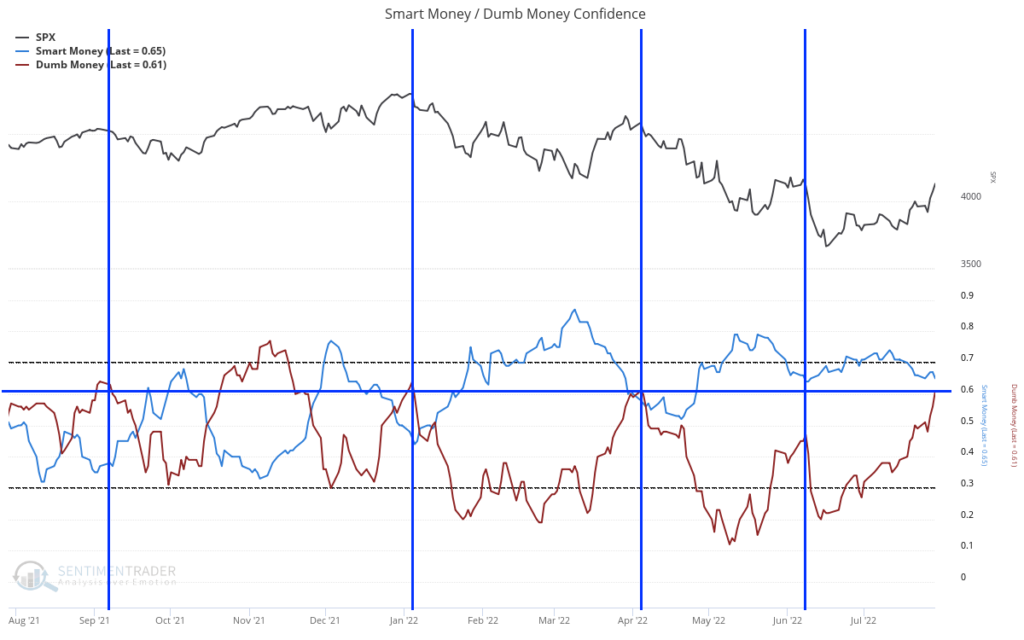
Dumb money confidence has exploded over the past month. The current level has been consistent with prior drawdowns during this bear market, as the blue lines show.
Seasonality is Concerning
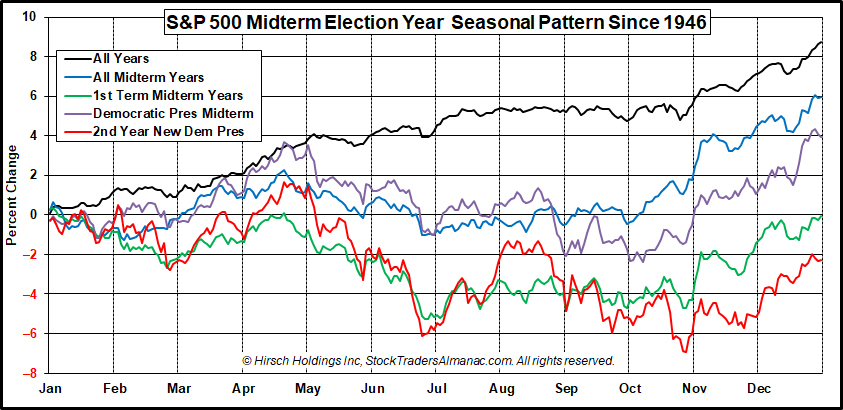
Below is the Stock Trader’s Almanac seasonality for midterm election years, which are historically the worst years in a presidential term. As you can see, no matter how you slice it, markets often top in early August during midterm years, ultimately bottoming later in the fall.
Speaking of seasonality, August is the worst month in the year for the Dow & S&P 500, and 2nd worst for the Nasdaq since 1987. If that’s not bad enough, September is the worst month for the Dow, S&P 500, and Nasdaq since 1950.
The 200 Day Moving Average Might Be a Lid
Finally, we’re approaching the S&P 500’s 200-day / 40-week moving average (black line), which many shops use for getting in and out of the market. Paul Tudor Jones famously said “My metric for everything I look at is the 200-day moving average of closing prices”.
As you can see below, the S&P 500 frequently sells off the first time price hits that 200-day / 40-week moving average. Consider the blue arrows below.
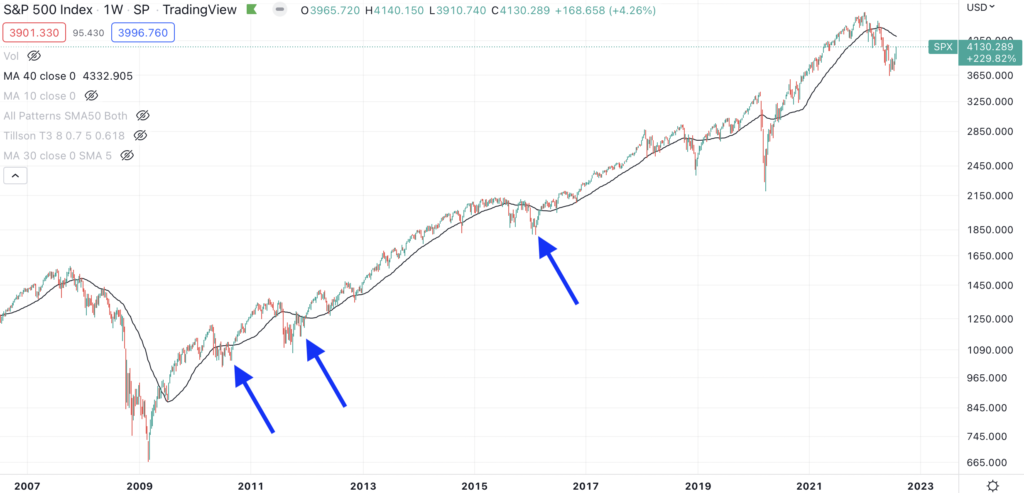
While there were some exceptions, I’m skeptical that this will be one, given retail’s optimism and poor seasonality. As always, I’ll change my mind if that data changes.
Roku’s Miss & Advertising’s Great Depression
Before you roll your eyes at the “Great Depression” headline, please indulge me by looking at the Great Depression’s drawdown, which was roughly 90%.
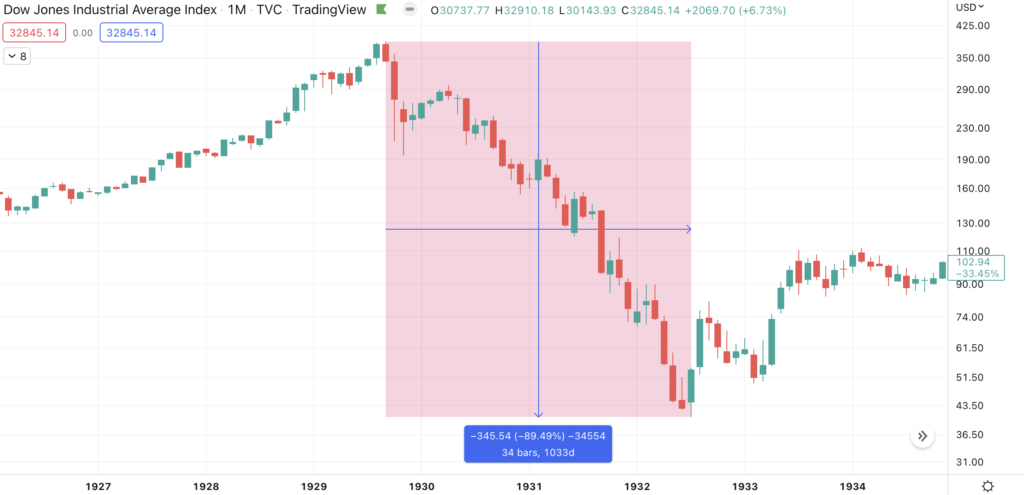
Unfortunately, many advertising companies have suffered similar drawdowns this year.
Roku is the poster child of this in my portfolio, as they are the only advertising name I held because I’m still bullish on their potential, and they fell months before I implemented my trend model.
This week, Roku posted their first miss since February 2017, while pulling their full year guidance. They paid for it dearly the following day.
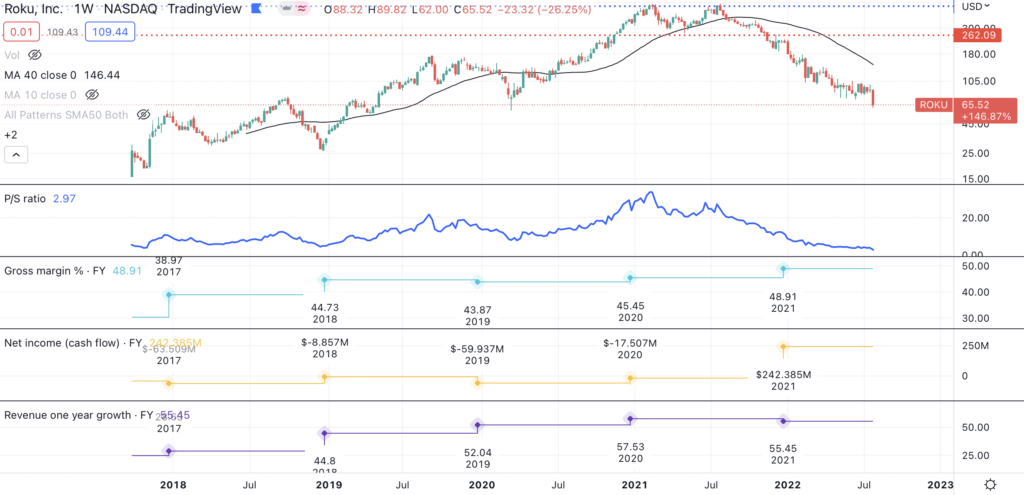
Roku fell 26% this week, with just about all of that occurring after earnings on Friday.
But also notice Roku’s fundamental metrics relative to their price to sales: gross margins, net income, and revenue growth. Although their price to sales ratio is at an all-time low of 2.97x, their gross margins, cash flow, and revenue growth is still stronger than at any time of the company’s history.
On top of this, Roku added 1.8 million new users, the same quarter that streaming stalwart Netflix lost 1 million users. While that user growth is strong (and exceeded expectations), the markets are forward looking, not backward looking. Given this, I’m asking the following questions about Roku’s future.
Is Roku losing market share?
No, Roku gained 1.8 million users the same quarter Netflix lost 1 million users. Additionally, Roku is still the number 1 operating system in the USA.
Has the streaming business changed negatively?
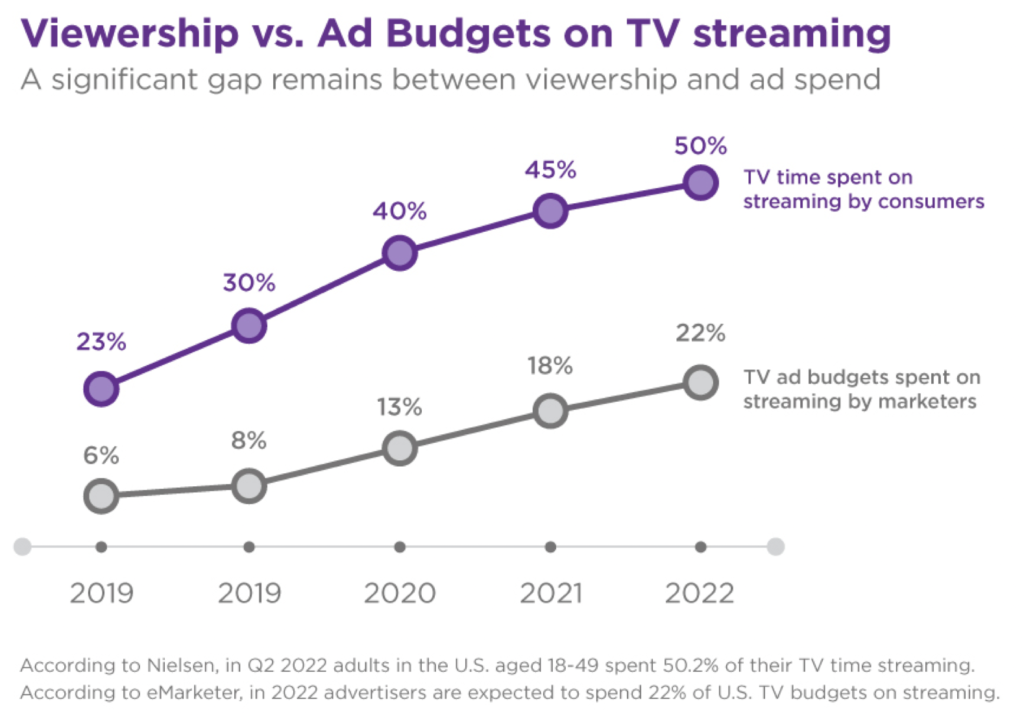
No, tv time spent streaming keeps increasing, as are ad budgets, and there is still a wide gap between ad spend and viewership.
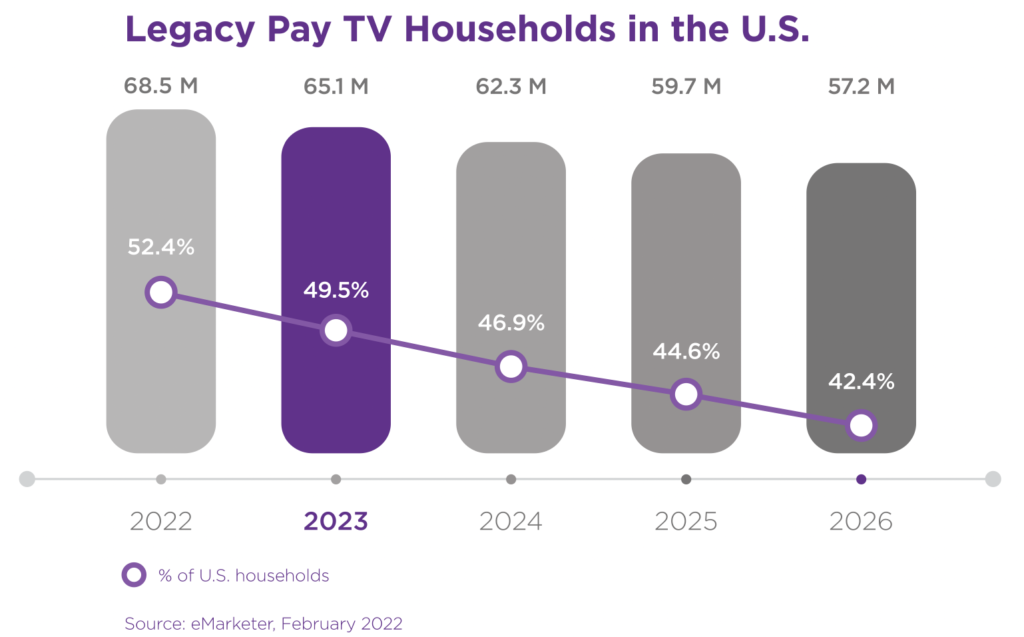
Additionally, more and more USA households are abandoning legacy television. These users leaving will likely join a new operating system, and Roku is the market leader.
Are these problems outside of Roku’s control?
I believe so. The shipping backlog compromised their dongle business, which they are still selling for a loss. Additionally, consumer sentiment is at all-time lows, as mentioned before, and below is a quick refresher.
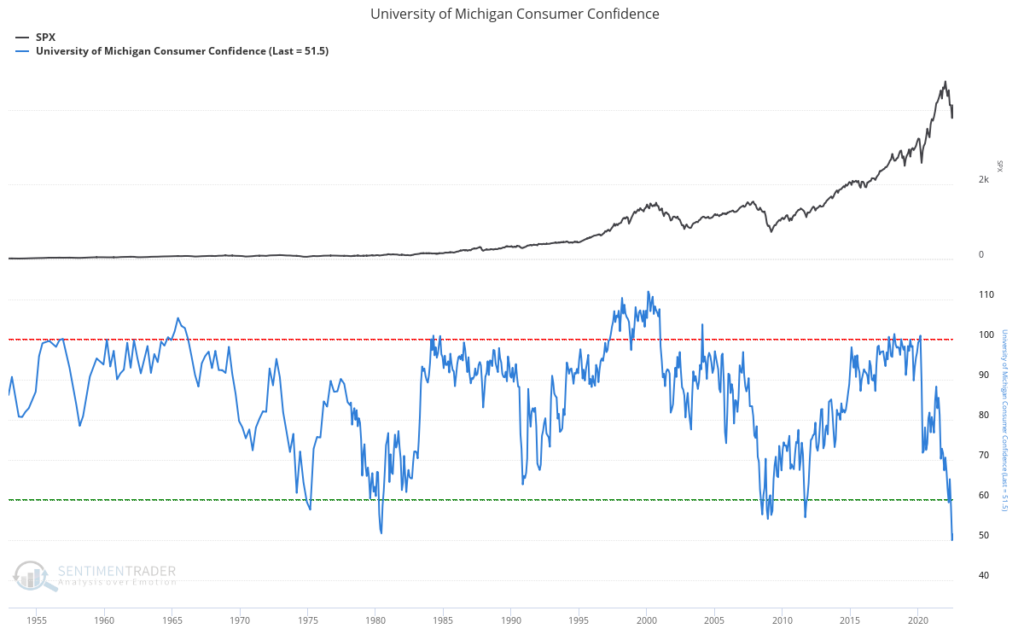
People aren’t buying new televisions in market envrionments like this. Despite that, Roku still added 1.8 million users.
Finally, every advertising business has been massacred in this drawdown, which is why I’m calling this advertising’s Great Depression.
Ultimately, I believe this depression is creating investment opportunities of a lifetime, and Roku is one of those opportunities.
Great Advertising Businesses Killed by this Recession
Aside from Roku, here are some more businesses that are on my radar during this advertising depression.
Magnite $MGNI was one of my biggest winners from 2020, and is the market leader in supply-side connected television advertising. As you can see below, their revenue growth and cash flow is accelerating. Despite this, Magnite is priced similar to July 2020.
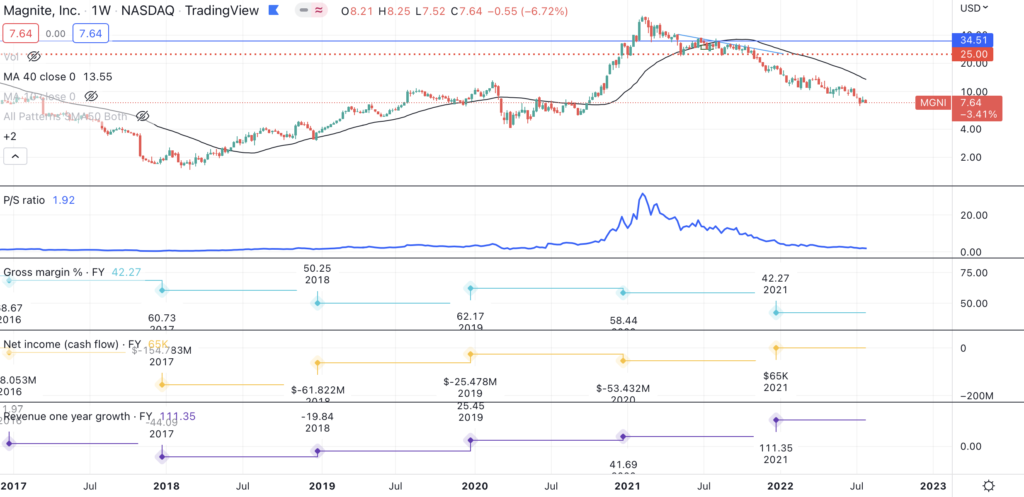
Magnite is trading near their all-time lows relative to sales, despite having a business that grows revenue faster and makes more cash flow than ever before.
Digital Turbine $APPS is another. They changed their revenue recognition model during their last earnings, which made it seem like they missed analyst expectations. >80% of trading is algorithmic, and they don’t always care about nuance. Needless to say, the company sold off hard and is valued near their all-time lows relative to sales.
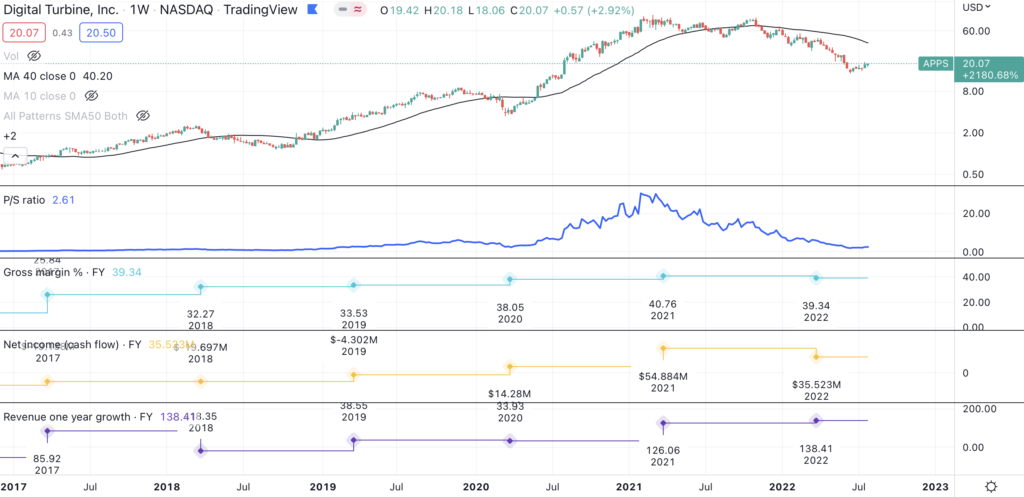
Once again, their revenue growth is still accelerating, and their cash flows and margins are not bad. Despite advertising being in such a tough place, and $APPS being down 80% from November 2021 highs. The business still looks far stronger than before.
Finally, we have Snap $SNAP. Their earnings miss in October 2021 was a canary in the coal mine for advertising. Price is rapidly approaching their COVID lows, and their price relative to sales is at an all-time low.
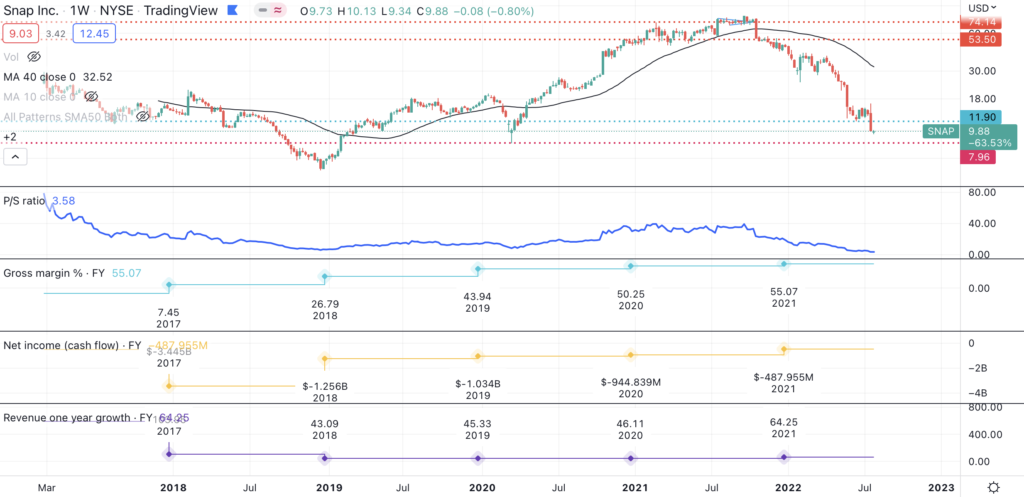
Once again, though, look at the business. Would you believe that margins, revenue growth, or cash flow are stronger than they have ever been?
I’m sure you’re thinking, “sure, but what about TikTok?” TikTok is certainly a threat for all of social media, but Snap’s DAUs increased 18% YoY, beating Twitter (+16%) & Facebook (+3%) for user growth this quarter. Seeing that Facebook had declining numbers last quarter, I would argue that Snap is in a better competitive position against TikTok for now.
While none of this will offset Roku’s losses, I adamantly believe that once this carnage is over, there will be an incredible opportunity in advertising. I’m keeping an eye on these names, and will vote with my dollars once I believe this trend is turning back up.
Unfortunately that time is not now, so let’s look at the sectors showing relative strength.
Market Trends – Solar is Strongest, China Broke Down
You’ll probably notice a lot more green compared to prior weeks. Please remember, though, that the long term trend is down for everything except defensives (utilities and consumer staples) and solar. Until the long term trends turn up, I don’t plan on getting too bullish.
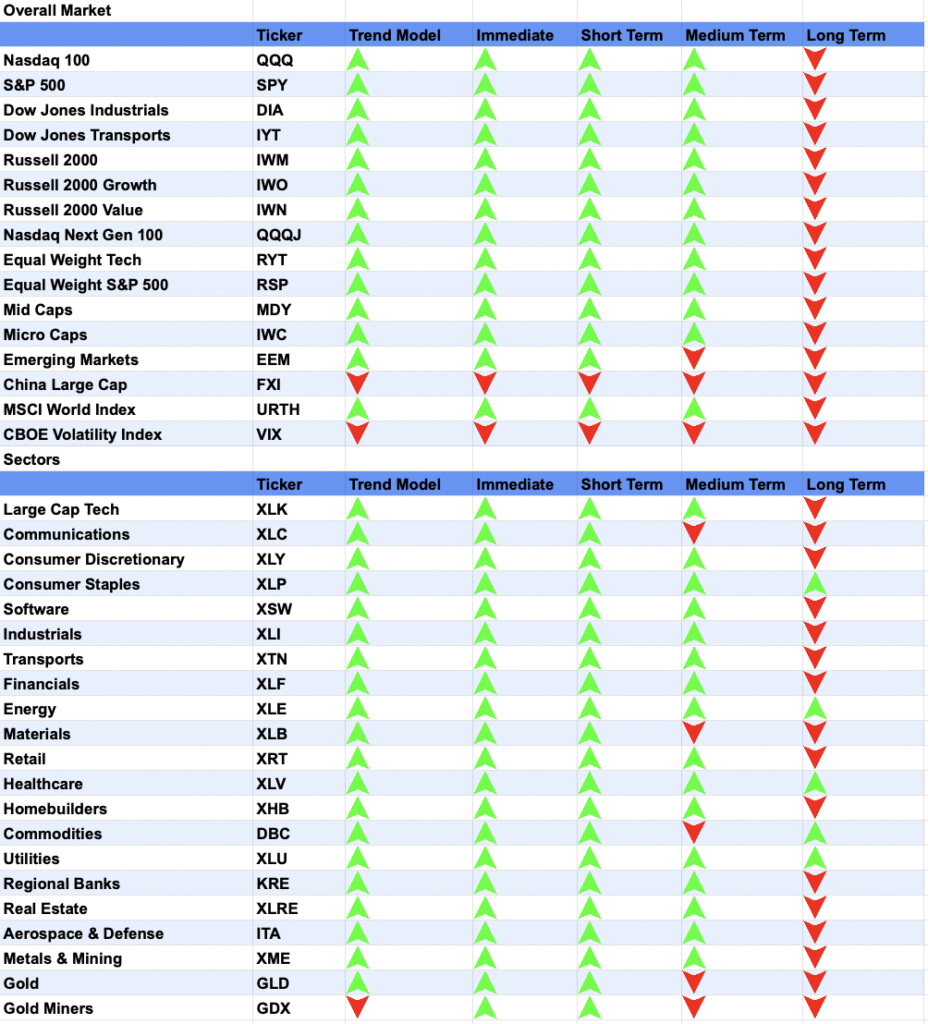
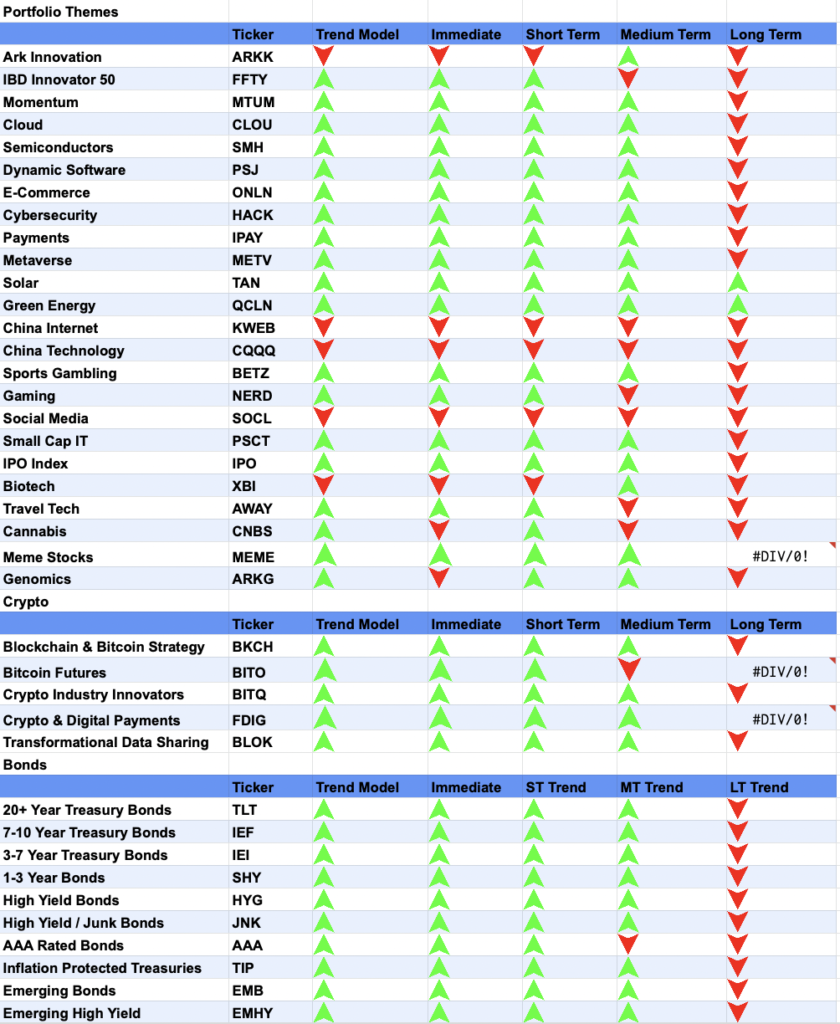
Speaking of solar, we saw major breakouts after the Build Back Better Bill was brought back with Manchin’s support. This bill, rebranded as the Inflation Reduction Act, and with a budget closer to a billion instead of several billions, caused solar companies to explode this week.
Now, I don’t believe in buying the news. While these companies are blowing up, I’m expecting reality will set in eventually. Assuming solar’s relative strength holds during any drawdowns, I plan on being a buyer.
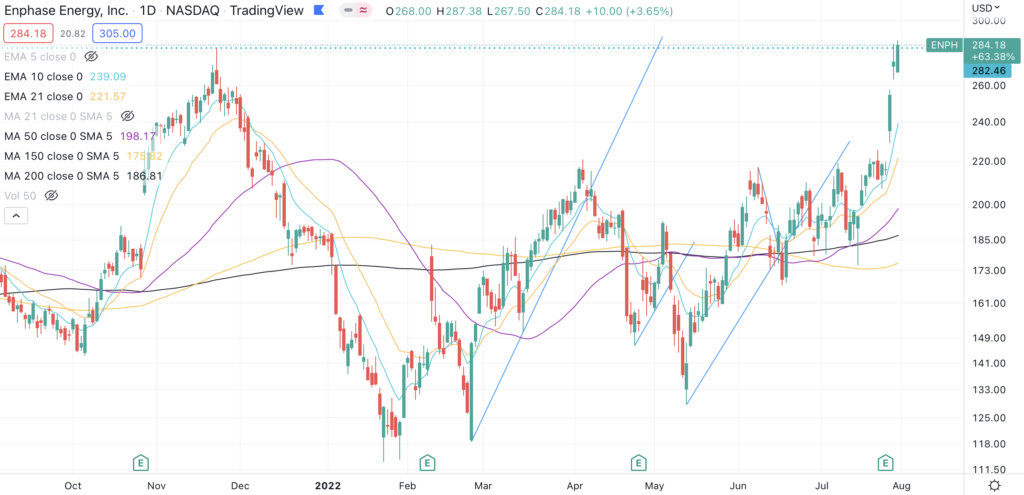
Enphase Energy $ENPH is #1 on my list, as they released a banger of quarter this week, and closed above all-time highs once the Inflation Reduction Act gained momentum.
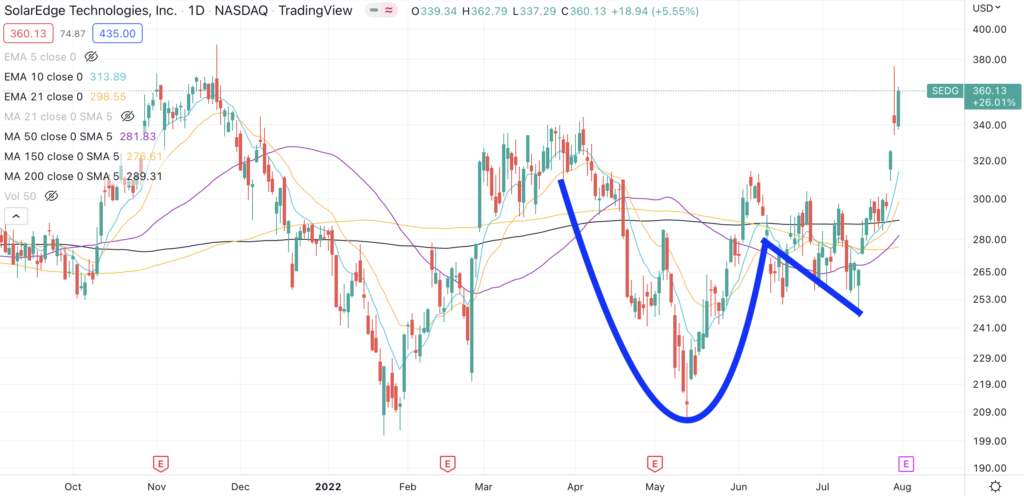
Next up is SolarEdge $SEDG, who broke out of a cup and handle after Enphase’s big beat and raise. They report earnings on August 2nd, and are right below all-time highs.
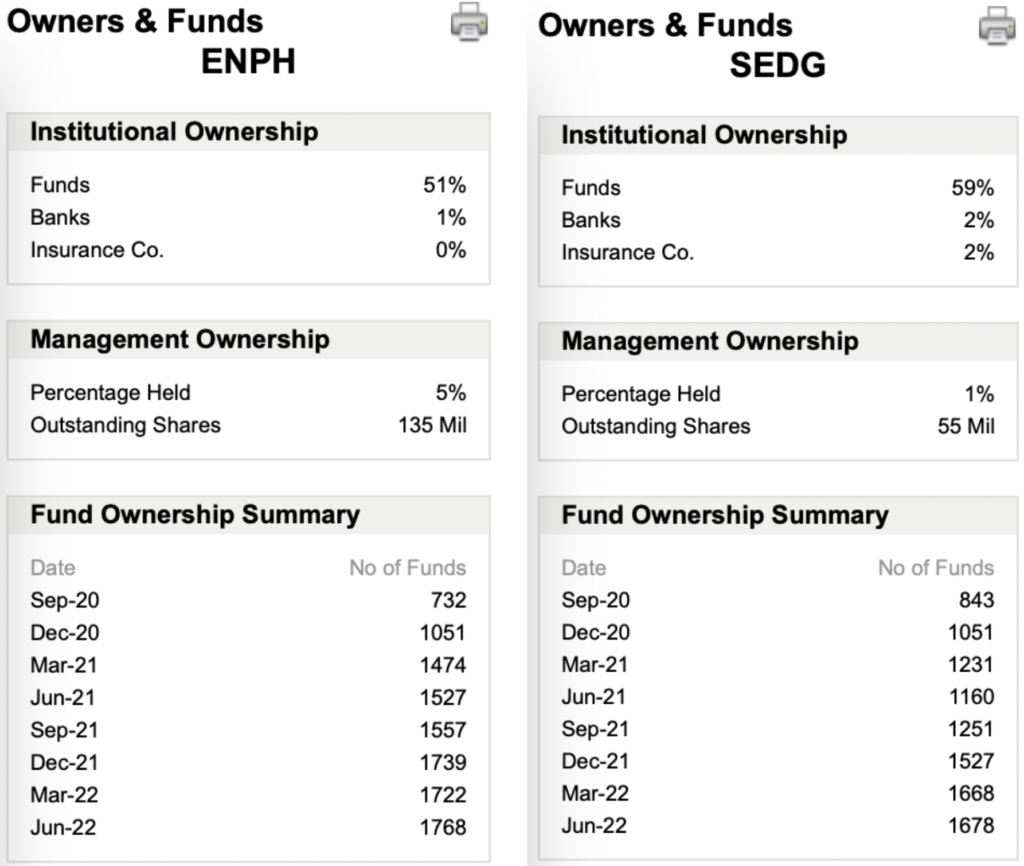
As you can see for both, institutional investors have been piling in over the past several quarters. This often serves as the rocket fuel propelling breakouts further.
Given that many of my highest conviction targets are still a mess, I’ll happily join these institutional investors when I find the opportunity. Right now, solar is high on my list, I’m just waiting for last week’s hype to settle.
China Broke Down
You also may have noticed that China isn’t on my radar anymore, this Chinese Internet $KWEB chart should show why.
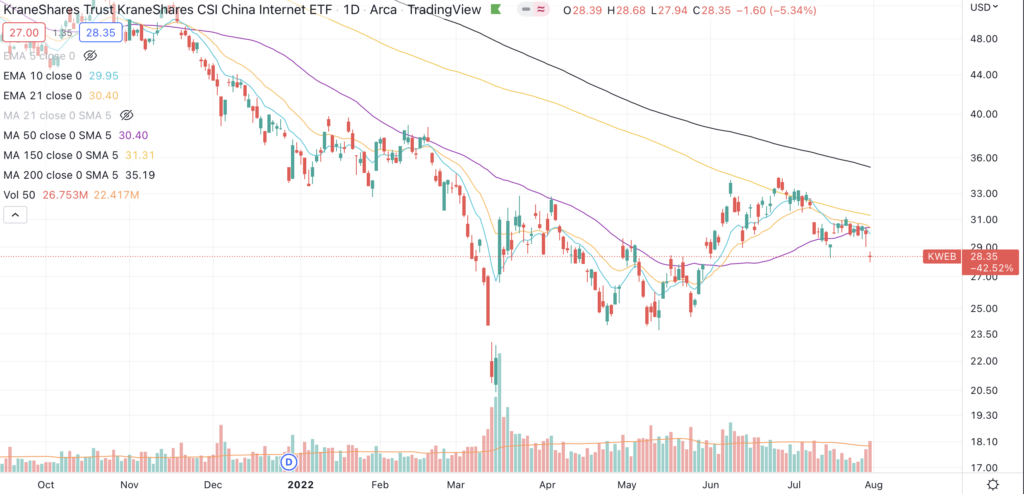
Notice the higher volume breakdown from the 50-day moving average (purple line) Friday, which resulted in a lower low.
I recently wrote about all of China’s negative headlines, and those narratives are unfortunately driving prices down. Pinduoduo was a solid initial winner, and I sold out of them and the rest of China as each broke down for single digit losses.
With all of that being said, isn’t it strange that $KWEB is still considerably higher than their March prices? The news is worse now compared to then, which means one of two things:
- The market hasn’t priced the news in yet
- The news isn’t actually that bad
How will we know if the news isn’t that bad? If $KWEB can reclaim the 200-day moving average (black line), and that moving average turns up, the news may not be as bad as we thought.
I sold out of my China names well before all of this bad news was known, and I believe price will telegraph if the news is not that bad. Until then, I’m sitting on the sidelines.
Sell: MongoDB
I was shaken out of this after price closed below the 50-day moving average, as well as their intermittent trend (blue arrow is when I sold). As you can see, MongoDB shot up after Microsoft & Amazon posted better than expected cloud results, reclaiming their trend on Friday.
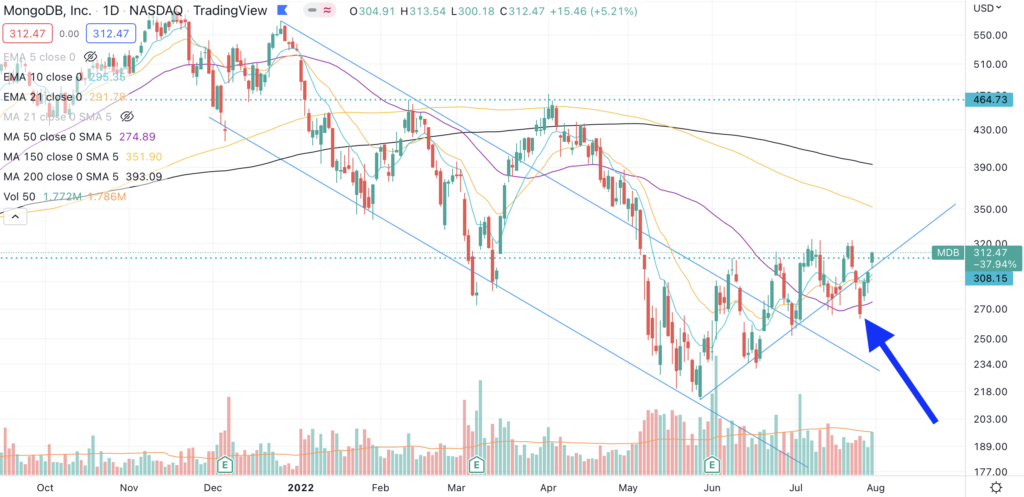
I have long been bullish on MongoDB, but am also far more conservative when we’re in bear markets. Unfortunately, this conservatism resulted in me missing Mongo’s run up.