Hey Everyone,
I hope you had a great week, let’s get into it
Portfolio & Market Updates
My portfolio fell -1.5% this week, which was well below the S&P 500 (+3.3%), and Nasdaq 100 (+2.7%), as well as Ark (+3.9%), and small cap growth $IWO (+4.8%).

This is probably surprising, given that all of my positions were up for the week. The issue was timing. I sold many of my holdings before the CPI report, and the market subsequently took off once the 8.5% CPI print was released on Wednesday morning.
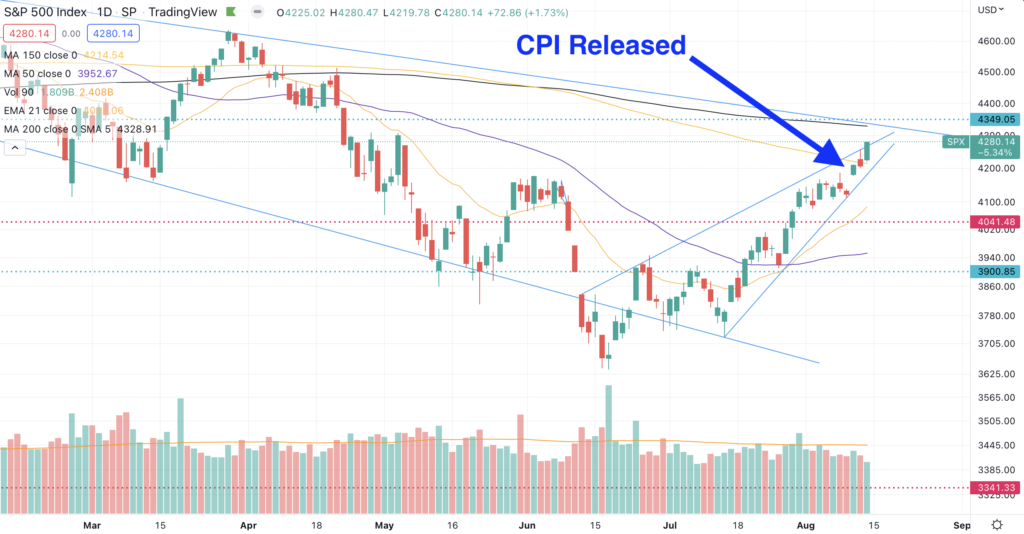
The market was down 0.6% during the first two trading days, and then rallied +3.8% for the rest of the week after the encouraging inflation numbers.
Typically news trades with the trend, and I have been conservative since the long term trend is down.
There’s another reason why I started selling positions once they broke below certain levels. The S&P 500 entered the box I targeted for this intermittent top in my July 29th summary.
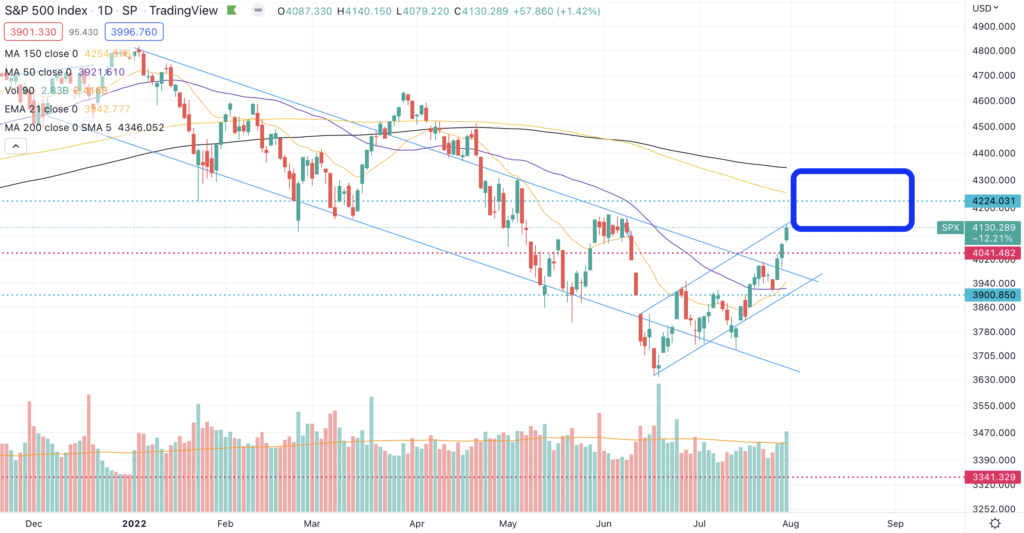
We are approaching the higher end of the box now, which coincides with the 200 day moving average (black line) which I believe will act as a lid over the short term.
The question is how severe any potential drawdown will be, which depends on whether or not we’re in a new bull market.
One More Drawdown, or New Bull Market?
The WSJ already claimed that we’re in a new bull market this week, and I believe that claim is premature. I will say, however, that there are many positive improvements since summarizing my concerns on July 29th.
Before discussing those improvements, let’s recap my concerns. Aside from the 200-day acting as a potential lid, there were two other items that made me more conservative.
- Retail Optimism Returning
- Seasonality is Concerning (August & September are the worst months of the year)
Speaking of retail optimism returning, dumb money confidence went straight up over the past week (red line), while smart money confidence (blue line) went straight down. In other words, my retail optimism concern has become more concerning.
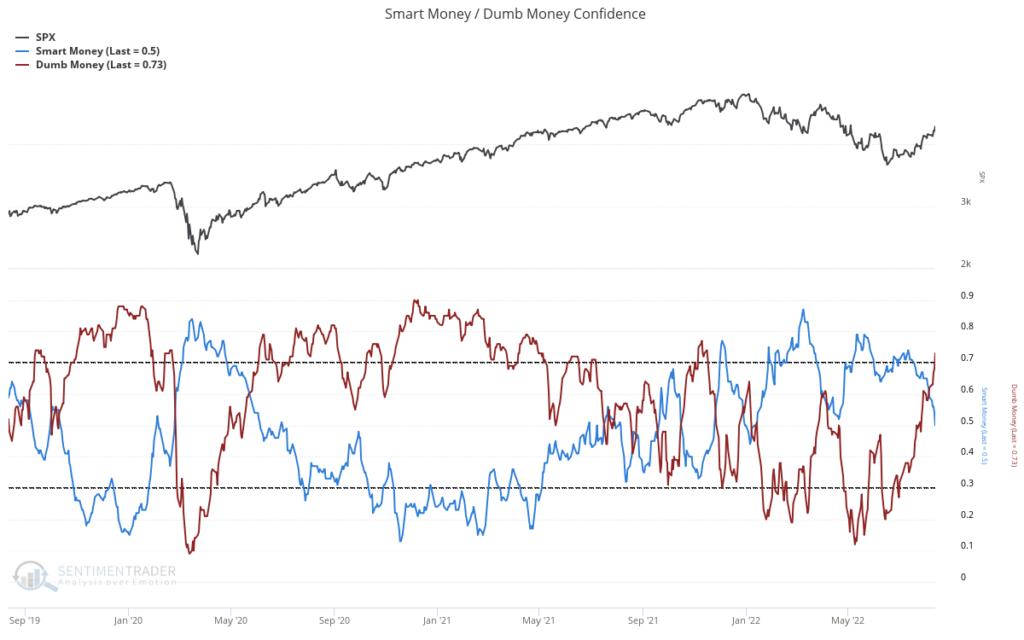
On another note, if the inflation print is as bullish as the reaction we saw last week, shouldn’t smart money confidence improve as well?
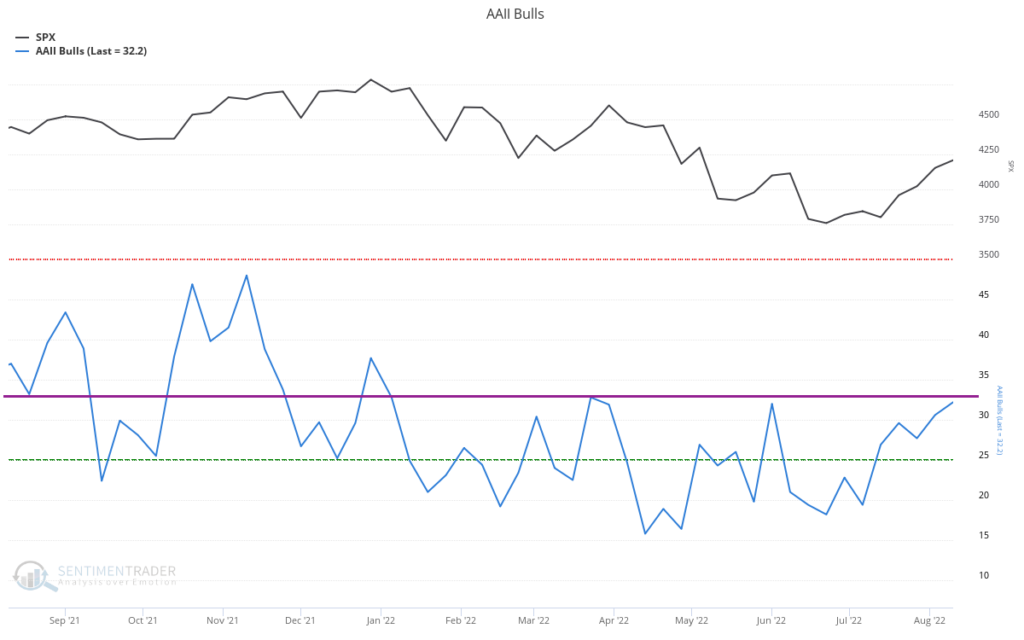
The AAII Bull Survey was also concerning, as the bullish levels (magenta line) have coincided with prior drawdowns during this bear market.
Potentially Bullish Signals this Week
However, these items are only concerning if we’re still in a bear market. It’s possible we’re starting a new bull, as there have been some constructive improvements over the past two weeks.
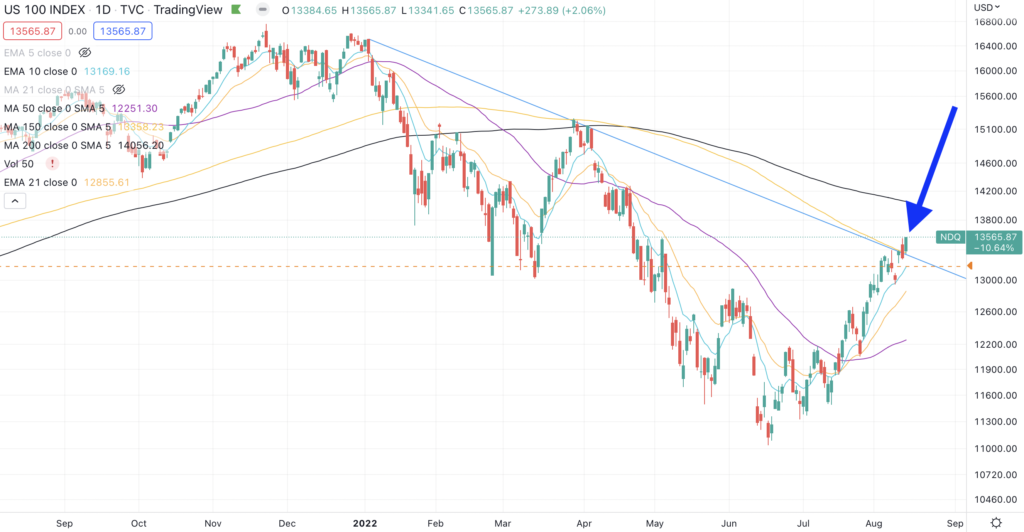
The Nasdaq 100 broke their downtrend line.
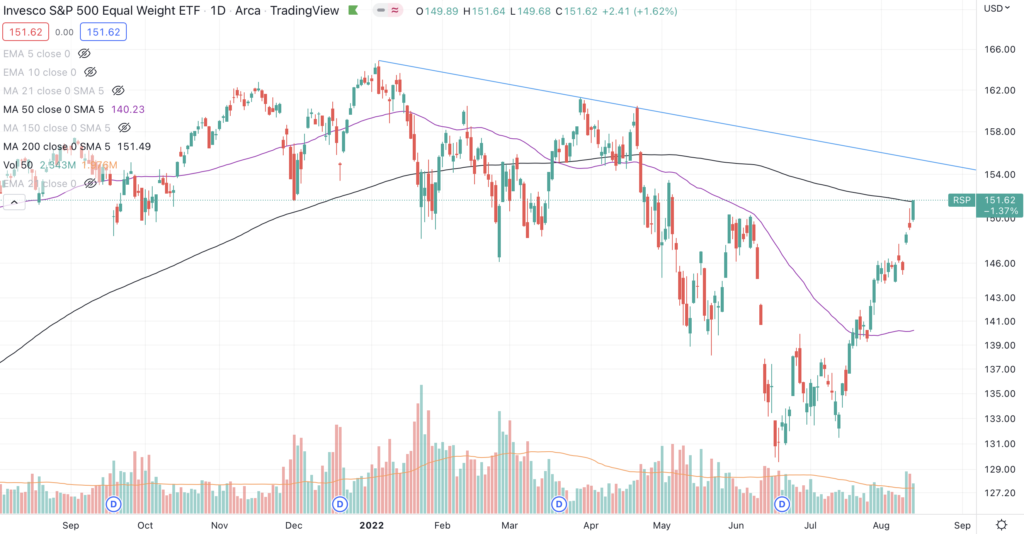
The equal-weight S&P 500 $RSP has already reclaimed the 200-day moving average
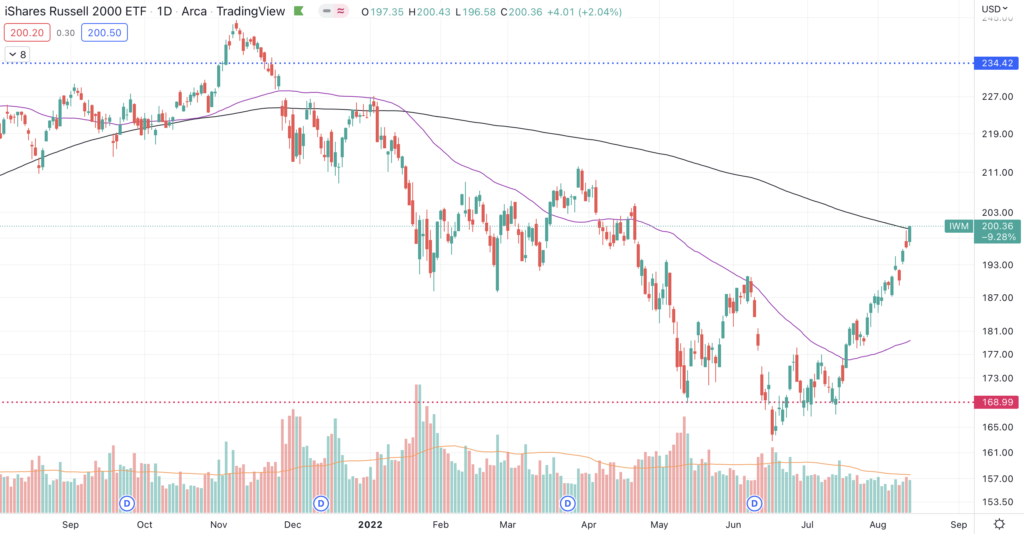
Small caps Russell 2000 $IWM reclaimed the 200-day moving average (black line)
MidCaps & MicroCaps have reclaimed their 200-day moving averages (black line)
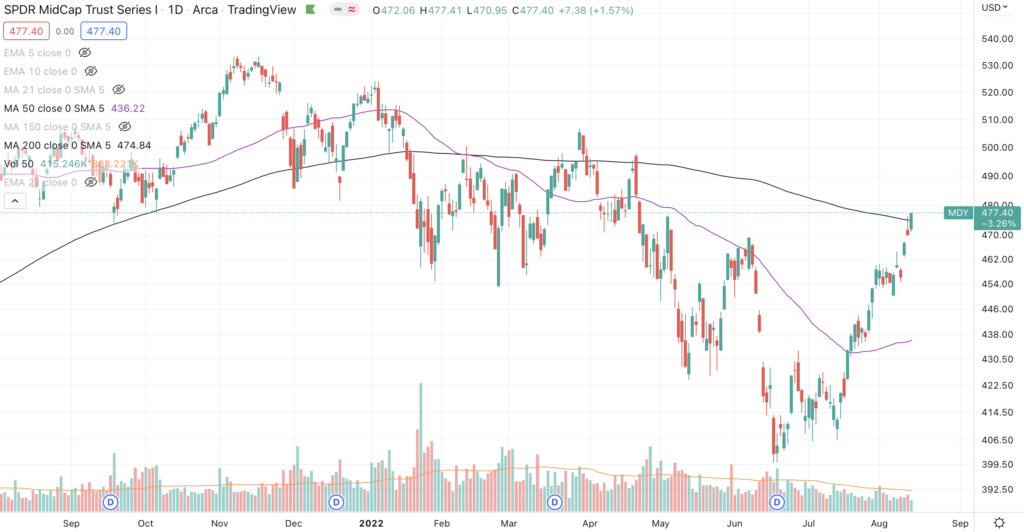
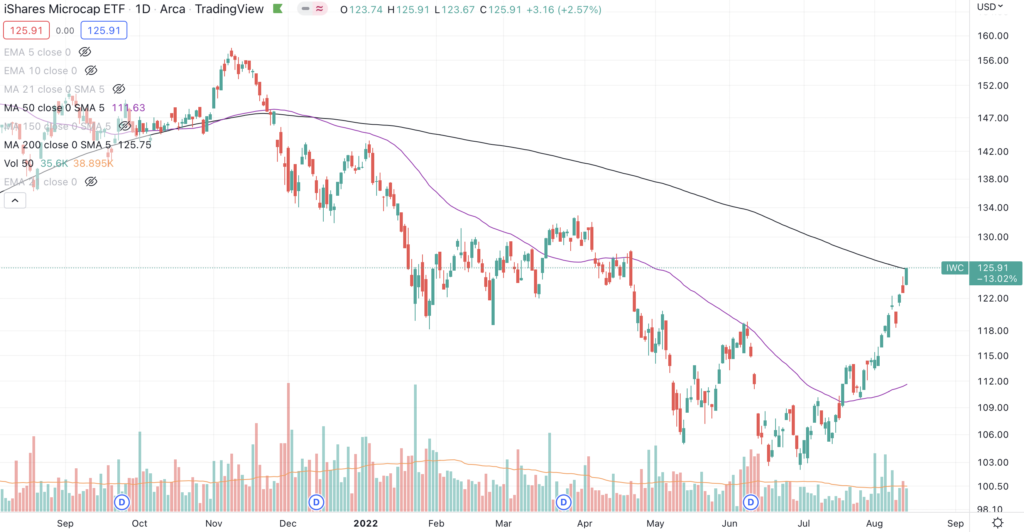
These 200-day reclaims are a big deal. I wrote about the first losers becoming the first leaders back in July, and we’re seeing the names who rolled over first (small cap and biotech) reclaiming their longer term moving averages first as well.
While I am more receptive to a new bull starting than I was 2 weeks ago, my bias is still negative given the how poor August & September have traditionally been.
Michael Burry said it best on Twitter earlier this week, when he wrote about how brutal bear markets can be.
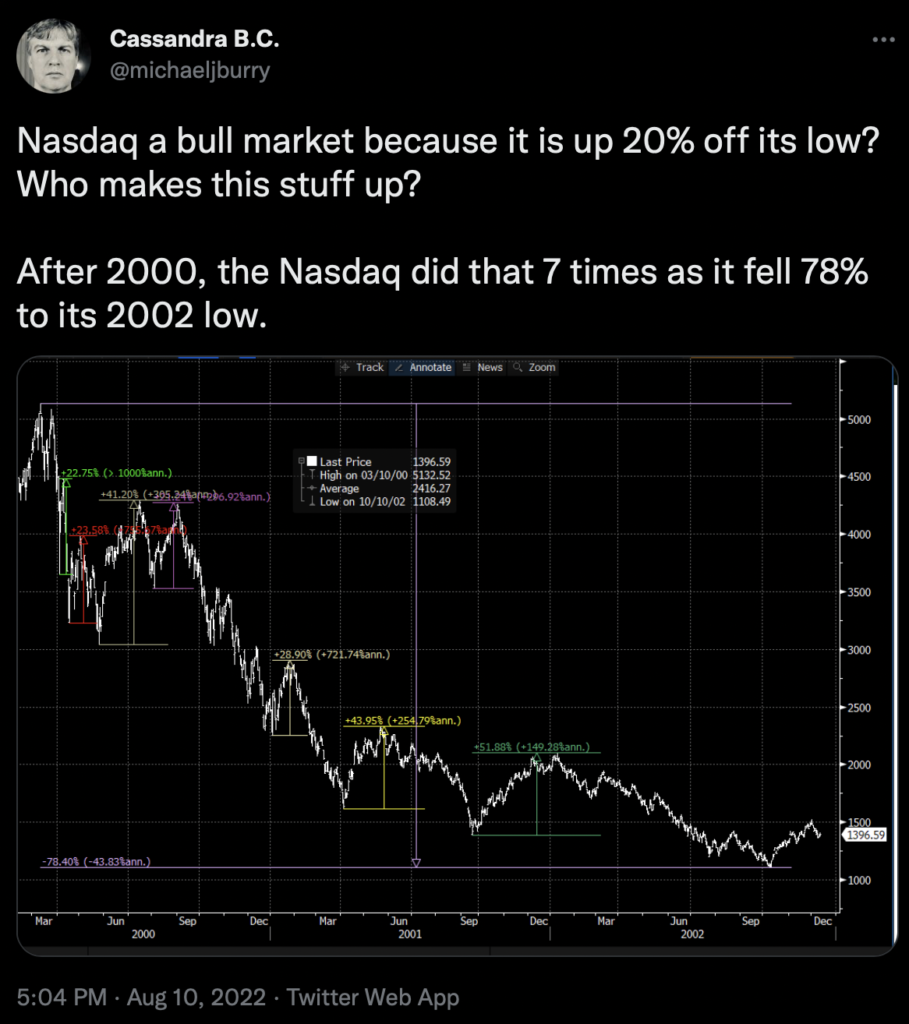
In other words, all of the constructive stuff I summarized have happened during bear market rallies before, and new lows eventually followed. Therefore, I’m not taking this constructive action as gospel just yet.
Market Trends
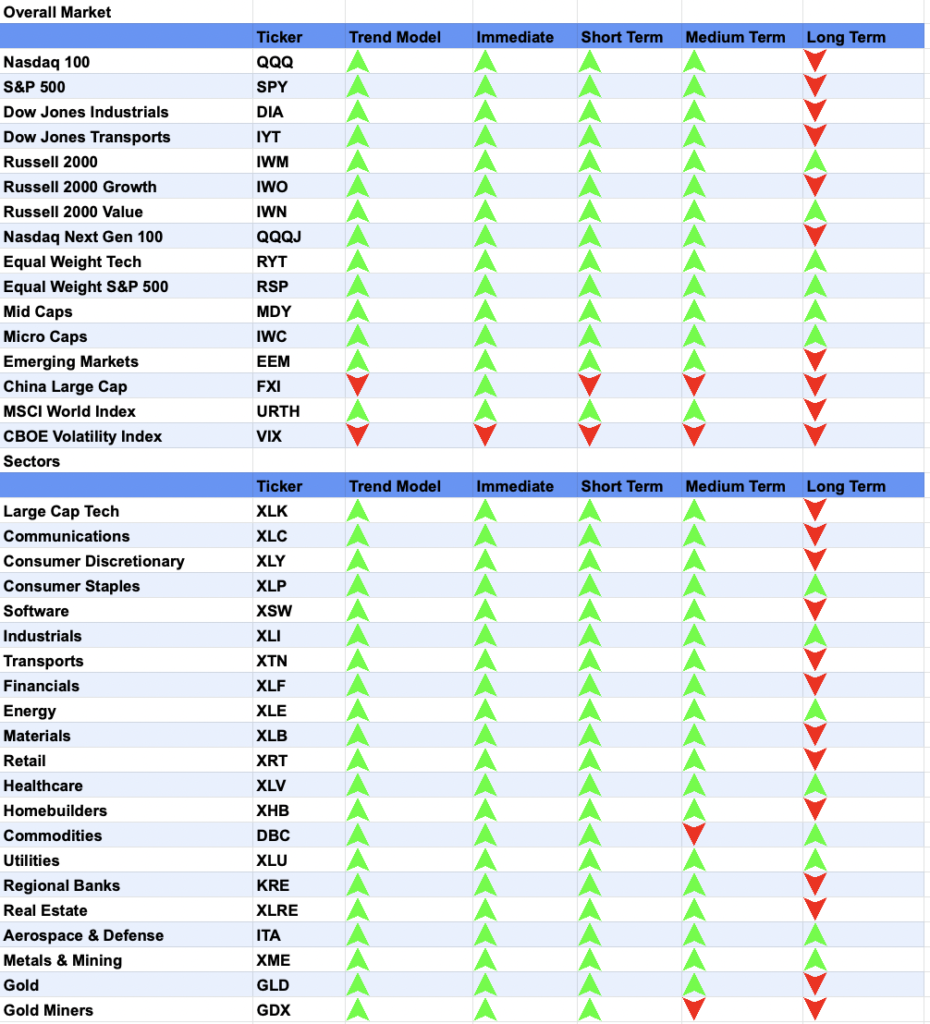
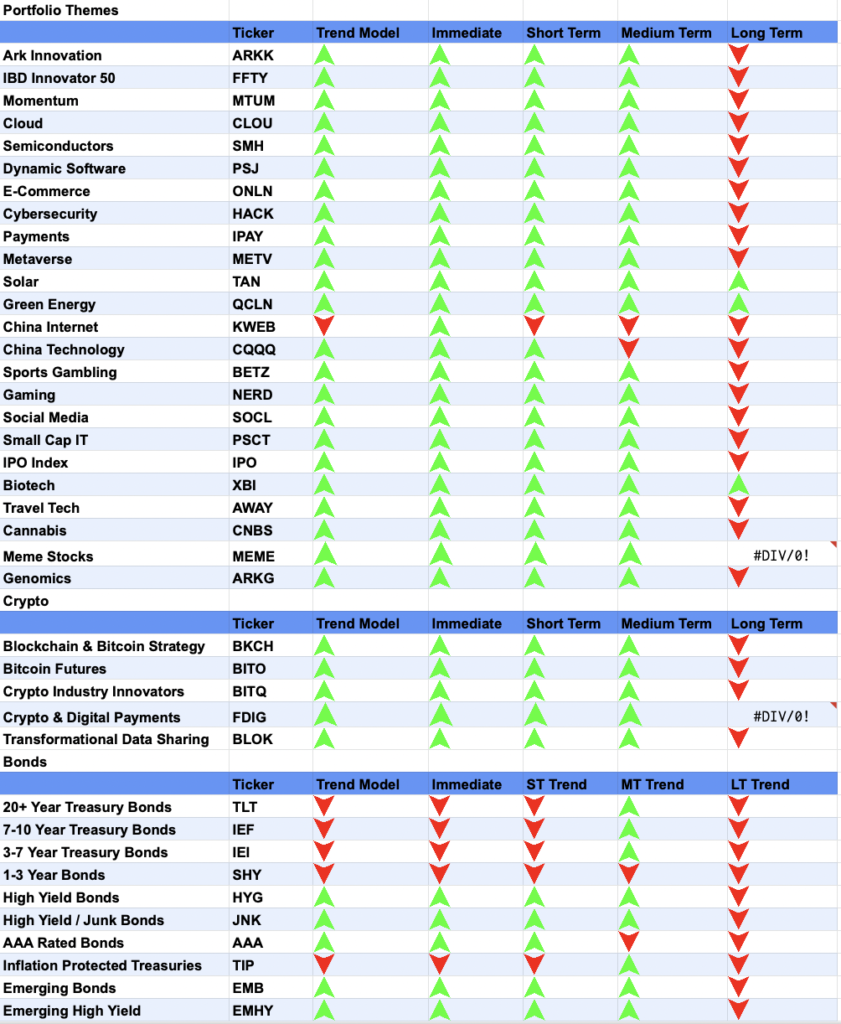
Which takes us to market trends. While bulls are seeing improvements overall, solar energy and biotech are the only two themes who’s long term trends are looking up.
Speaking of solar, I couldn’t help but notice Barron’s magazine cover this week.
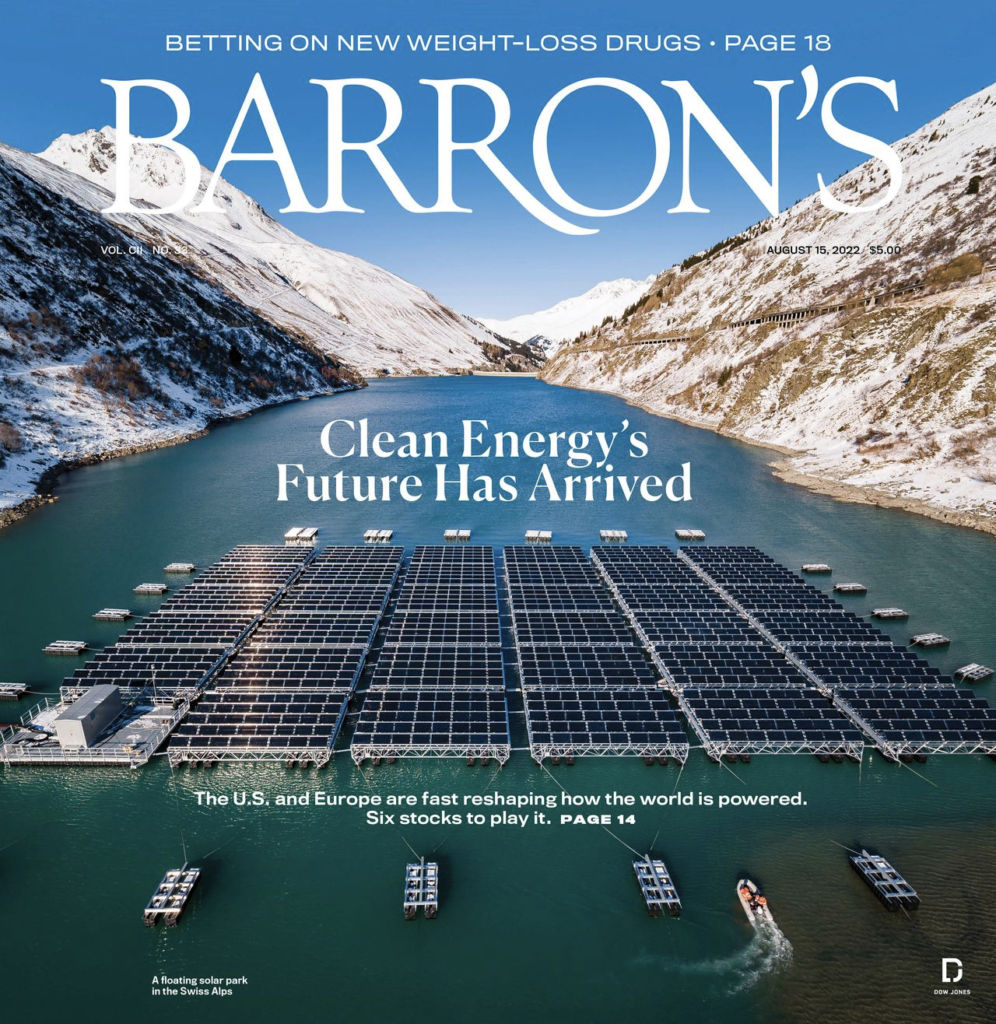
My gut reaction is that solar is about to correct, as magazine covers are often great contrarian indicators. The Economist, for example, nailed tech’s top with this magazine cover right before the COVID crash.

Which makes sense in hindsight – their job is selling subscriptions, not educating. By writing about what everyone already knows, you maximize your engagement.
However, Barron’s was ahead of their time when they printed this article about inflation in May 2021.

CPI was 5% back then, and inflation has increased dramatically over the next 12 months.
How will we know if solar has more room to run? Looking at the leader Enphase, I believe the setup is quite simple.
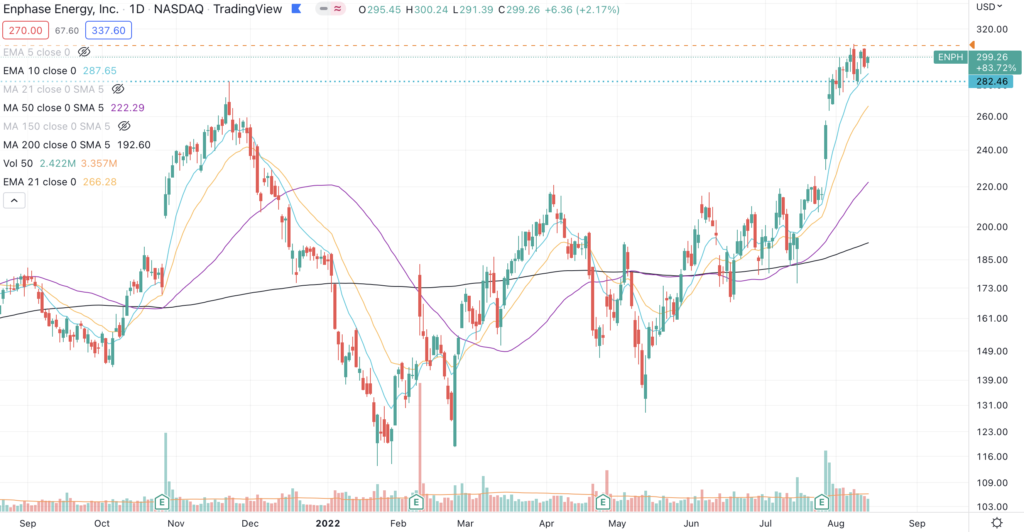
Prices consolidating above their November 2021 highs. If the stock breaks above this consolidation, I will likely buy this breakout. If it breaks below, the rising 50-day moving average (purple line) could be a compelling entry point as well.
I am surprised that leaders like Enphase did not break out after the positive CPI reaction. There’s a saying about “leaders leading”, and that did not happen last week.
Short (Position Closed): Metals & Mining (XME)
The metals and mining ETF $XME rolled over in April, and I shorted this while price closed below the 200-day moving average.
This felt like an asymmetric bet. Price tried breaching this level, failed, and could not reclaim the longer term moving average the following day.
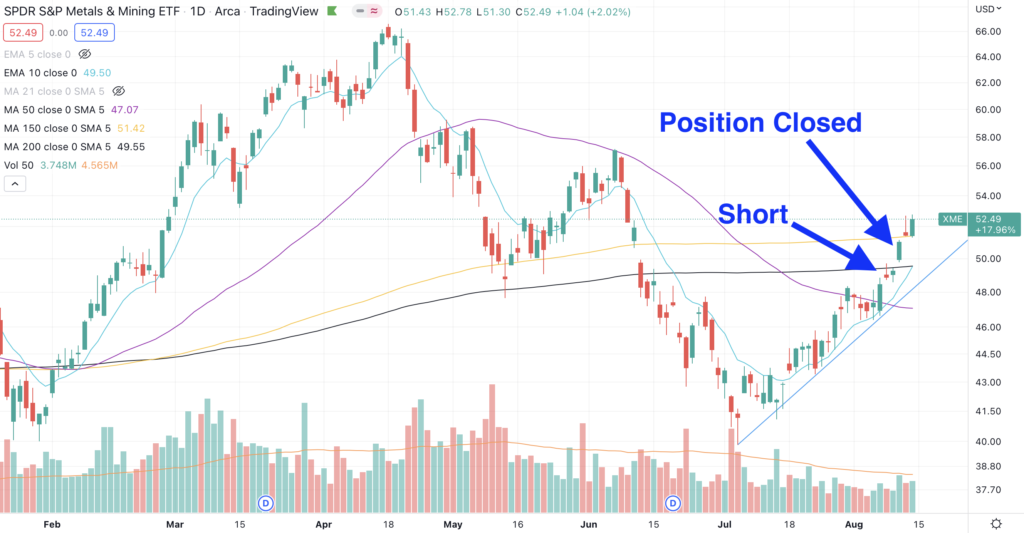
As we can see, I closed the position after the CPI print for a 4.5% loss. Price gapped up, and thankfully this short was closed, as it rose another 3% after covering.
Short (Position Closed): Truth Social (DWAC)
This was a tiny short, as there were no shares available for borrowing. Given that, I covered for a ~3% gain before the CPI print, fearing that print could cause a short squeeze.
Truth Social has been on my short list for months, and I’ll keep an eye on them for more opportunities.
Sold: Roblox (RBLX), Palantir (PLTR), Grab (GRAB), SentinelOne (S), Gitlab (GTLB), Instructure (INST)
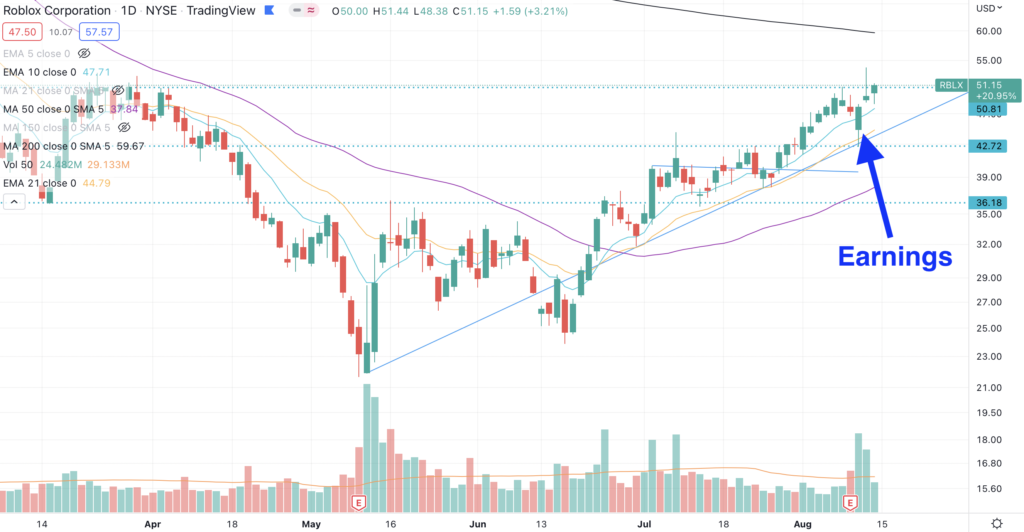
As mentioned at the beginning, these were all sold before the strong CPI reaction. Roblox & Palantir were sold after negative earnings reactions, but Roblox recovered after the positive CPI print.
Gitlab closed below the 200-day moving average, so I closed that as well out of concerns that there would be a negative CPI reaction. Since the CPI reaction was positive, Gitlab gapped back up above the 200-day.
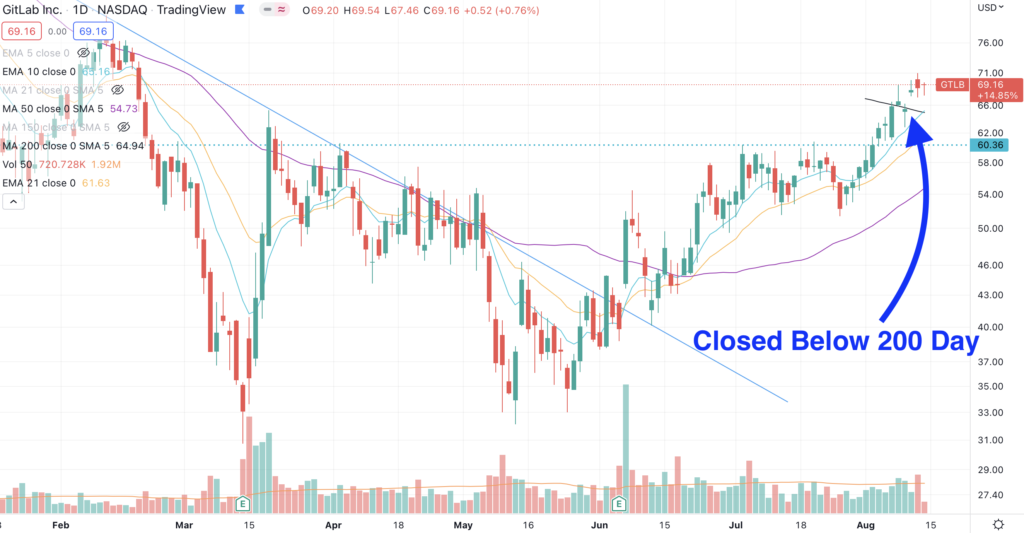
Grab also closed below a short term trend line this week, which is when I sold it.
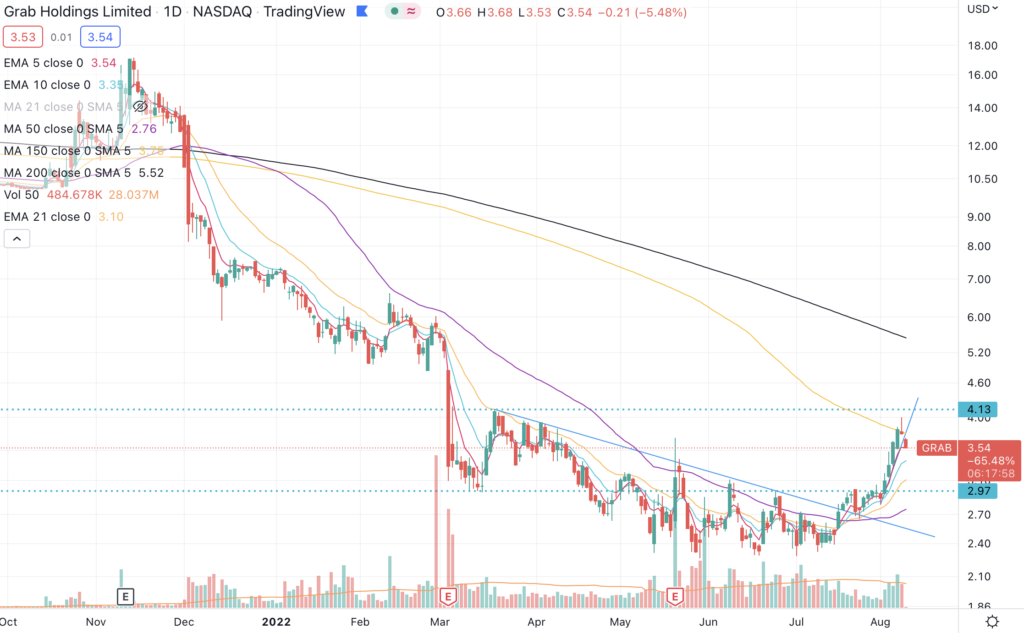
Fast forward to Friday, and we see they also had a positive reaction to CPI, price is resting above the 150-day moving average (yellow line).
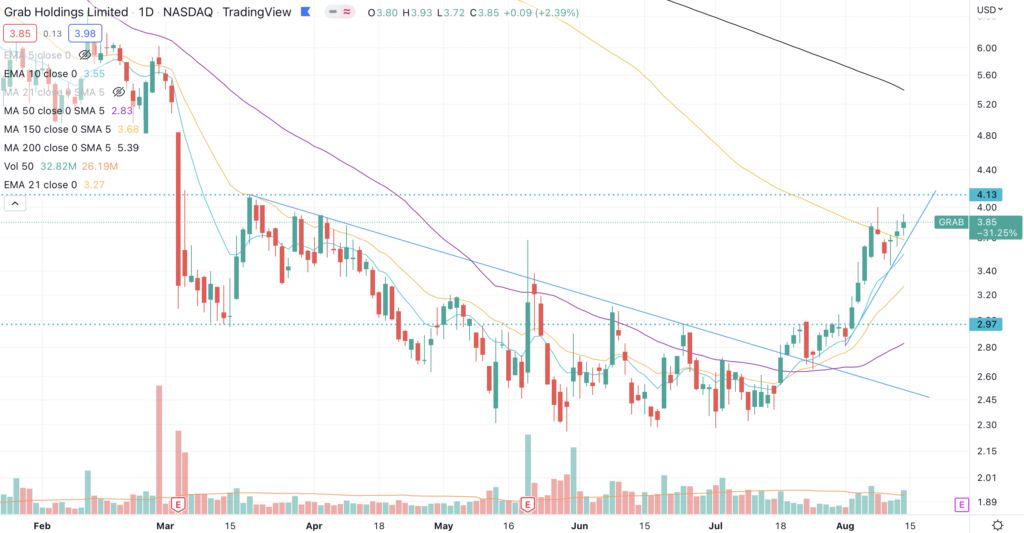
Given the positive reactions, all of the names that I sold are still high on my list, and I’ll wait and see with Palantir & Instructure. I’m worried about how the market will respond with Palantir’s miss longer term, and there are too many other names that are beating and raising right now. Generally, market leaders are beating analyst targets, not missing them.