Hey Everyone,
I hope you had a great week, let’s get into it.
Portfolio & Market Updates
My portfolio fell -1.6% this week, which was well ahead the S&P 500 (-3.3%), and Nasdaq 100 (-4.0%). Ark was in line with the Nasdaq 100 (-5.3%), while small cap growth $IWO fell (-4.9%).

I probably sound like a broken record about my high cash percentage blunting this drawdown, as I sold out of all positions except Roku & Twilio on the way up. Well, that’s exactly what happened again this week.
And while I was actually 100% long for a couple of days after purchasing my S&P 500 futures, this was after the S&P 500 had dropped by nearly -1.8%. As I mentioned on Slack, that position was sold for only a -1.5% loss (while the S&P 500 dropped -3.3% this week). I’m still betting on that bounce by the way, and will elaborate later.
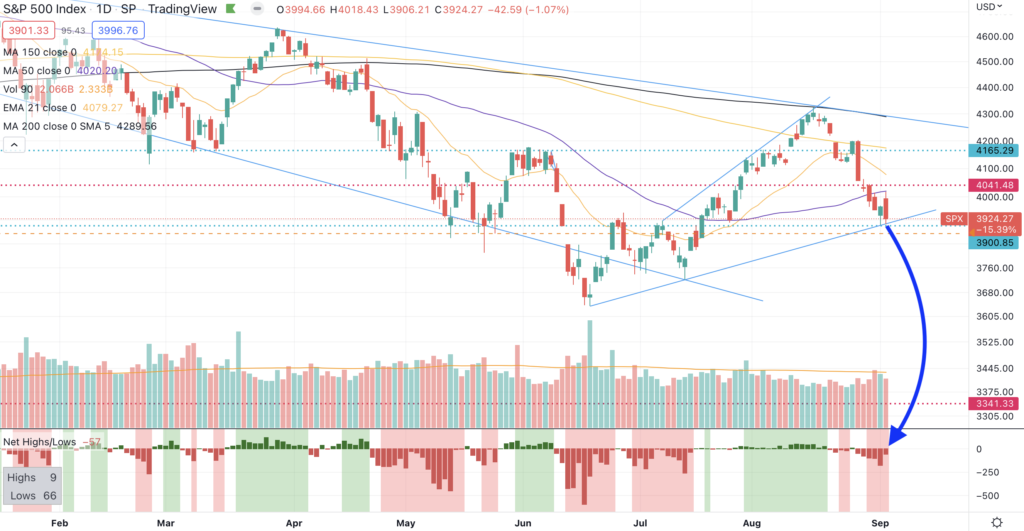
The S&P 500’s chart shows 3 encouraging signs over the short term, despite being in a longer term downtrend.
- Price held the intermittent uptrend line (top of blue arrow)
- There were far fewer lows in the NYSE, despite the market falling 1.07% percent (bottom of blue arrow)
- Price made a higher low from September 1st (explained at the bottom of this writing)
Why I’m Betting on a Bounce
Since July 29th, my mantra has been, “Longer Term Optimism, Shorter Term Concerns”. Here’s a quick recap of why:
- Retail optimism returning
- The 200-day moving average being a lid
- Poor Seasonality in August & September
We can cross two of those short term concerns off the list, as retail optimism has once again plummeted (more on that below), and the S&P 500 is now 9% below the 200-day moving average. This means it is no longer a short term lid, and more like a longer term indicator of the downward trend.
Which means all we have left is seasonality. Now we know about which concerns remain, let’s see explore the positive developments.
- The market is heavily oversold
- Retail optimism collapsed (as mentioned above)
- Heavy fund outflows this week
The McClellan Oscillator shows how heavily oversold the NYSE is. As the magenta line shows, the NYSE has been more oversold only 4x over the past 5 years.
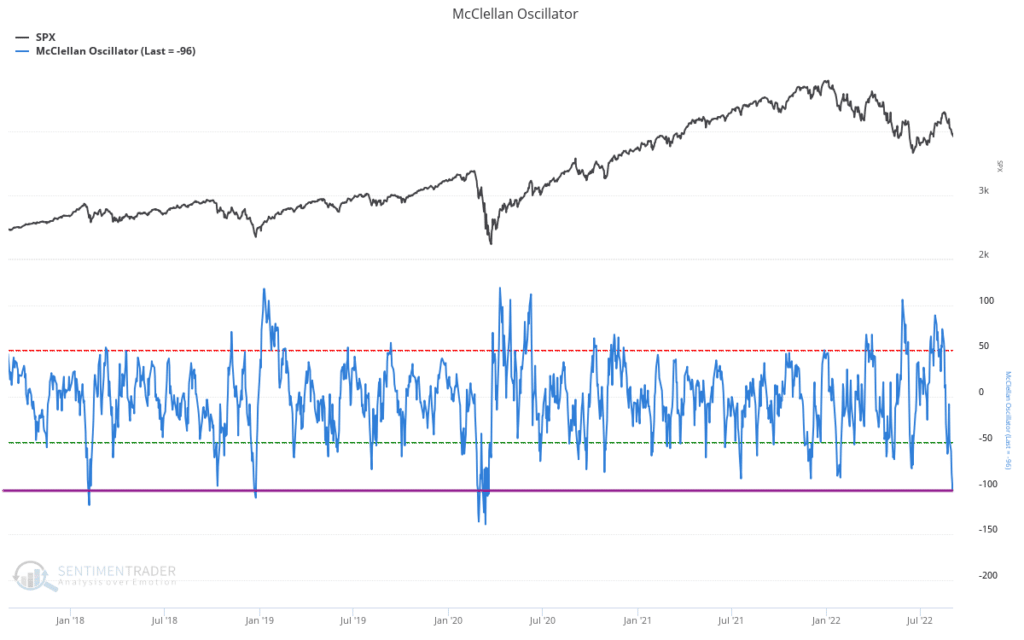
After every previous instance, price eventually had a solid bounce. While the COVID crash shows this can certainly move lower, the McClellan index can’t stay oversold forever.
Next we have retail optimism collapsing, and that’s not an understatement. Just last week, I wrote about how retail was “fairly optimistic”, the red line below shows that optimism is completely gone.
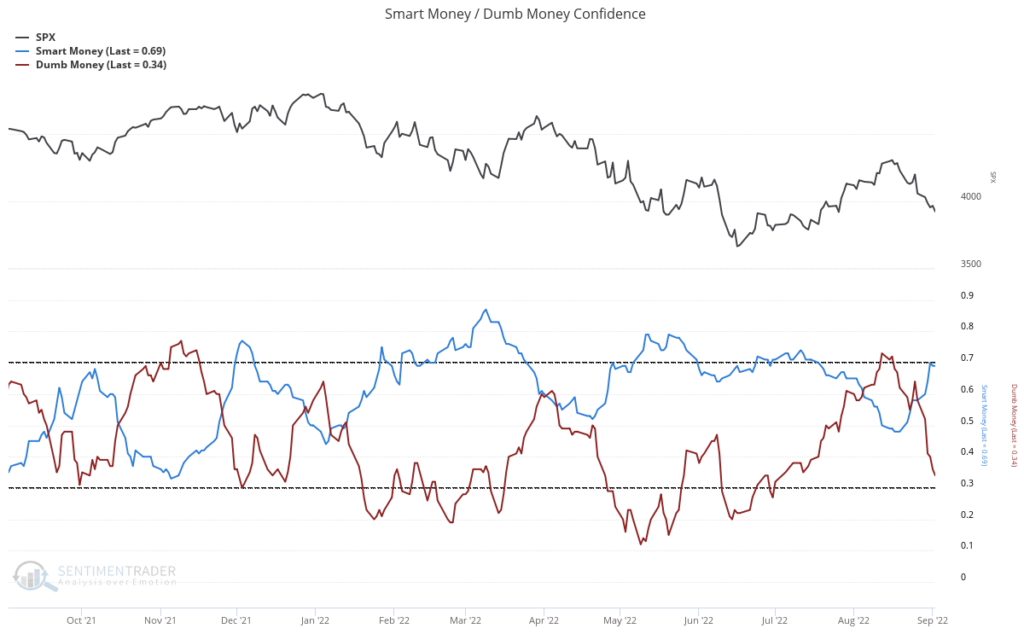
Coincidentally, the blue line shows that smart money became very bullish over this week as well. That tells me smart money is buying into this drawdown.
Finally, we had another week of high fund outflows.
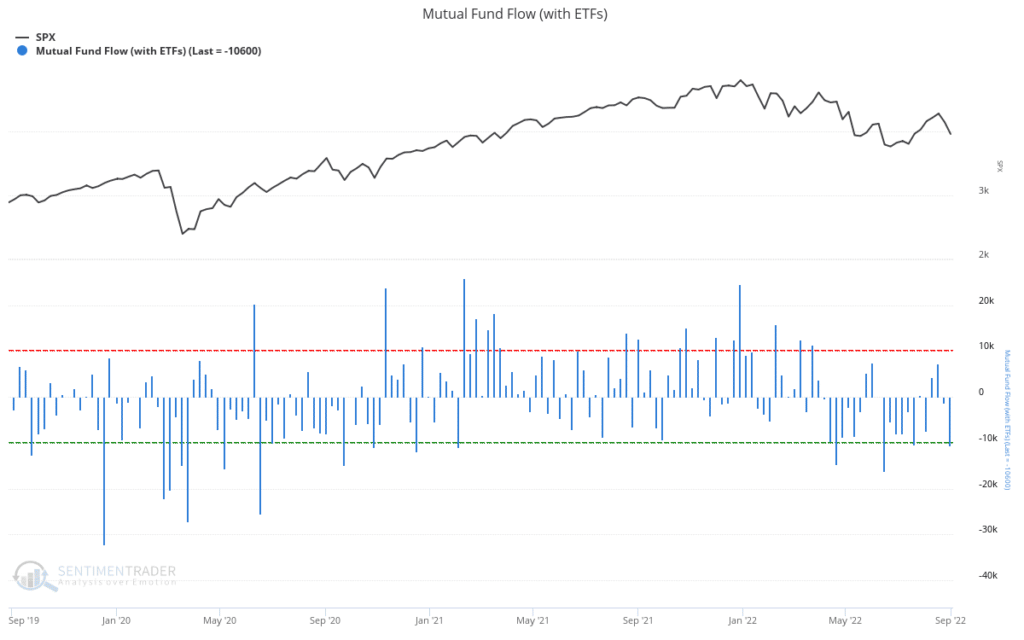
We admittedly have not seen a flush during this bear market, as we have with prior bears. Once you add a longer term moving average, however, you’ll see that this drawdown has been severe, albeit more calculated. Below shows fund flows with a 20 week moving average, which is essentially half a year.
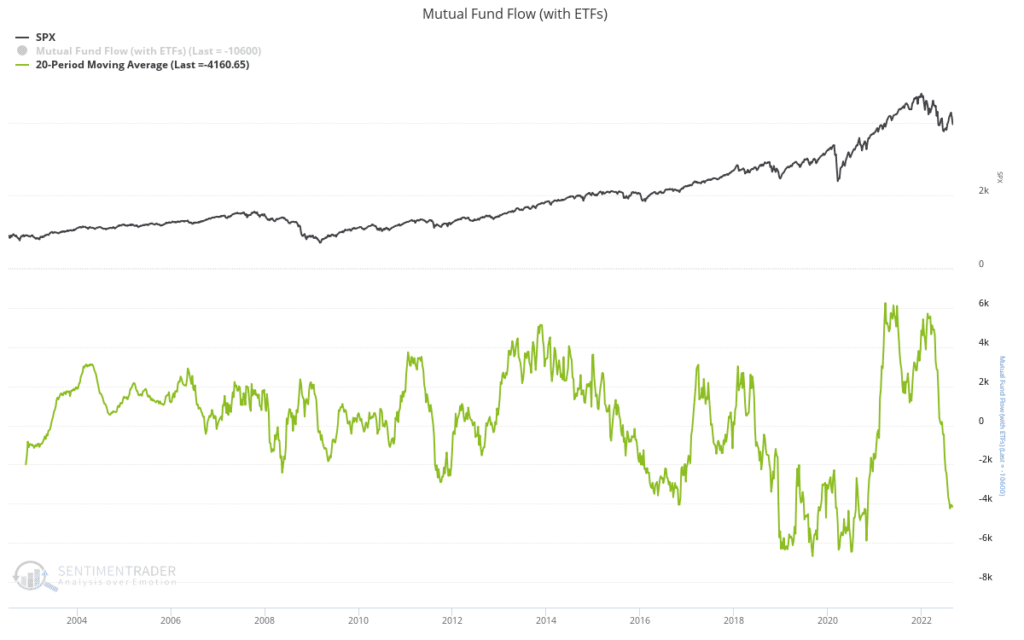
Looking at it this way, we see the fund outflows have been fairly dramatic.
Hopefully this explains why I plan on buying back via futures. Since I’m expecting a shorter term bounce for now, I believe it will be easier timing the market than timing an individual stock.
Tech’s Bearish Season Begins
Another reason why I’m not targeting individual stocks is that many stocks I track are entering their most bearish season of the year.
SentimenTrader shared this chart earlier in the week, highlighting that technology’s bearish season starts on August 31st, and ends on October 12th.
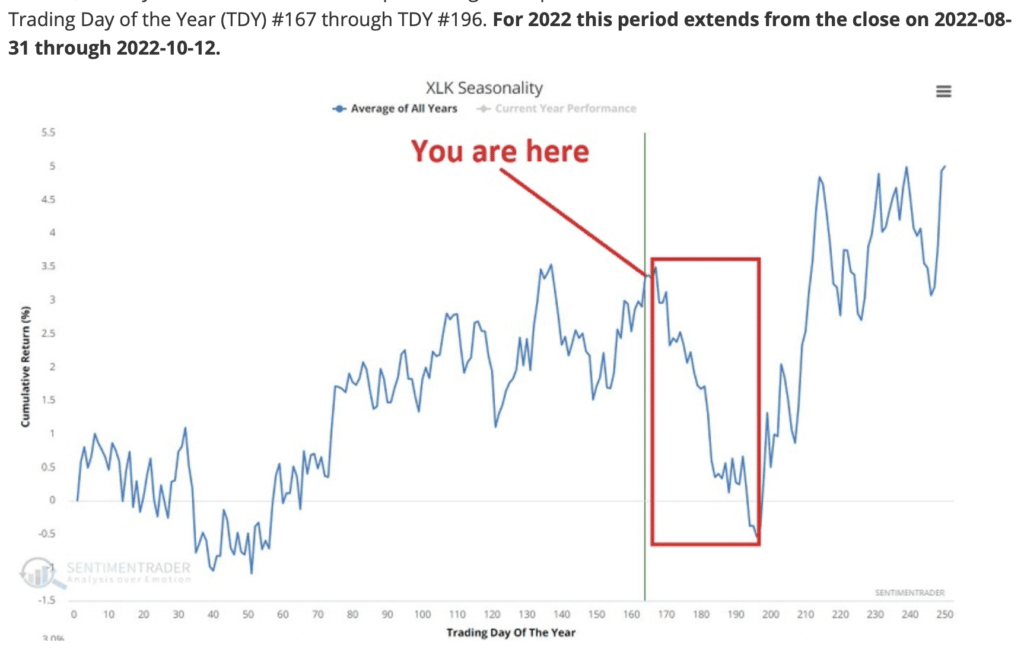
While I don’t plan on abstaining from focus companies until October 12th, I will scrutinize any new positions due to this. You may remember last year that I aggressively opened positions near the end of this seasonality, and was rewarded handsomely over the next 6-8 weeks. I plan on doing the same again this year.
But what if you buy those companies now and just hold on, just how bad could this drawdown be? Well, SentimenTrader ran the numbers.
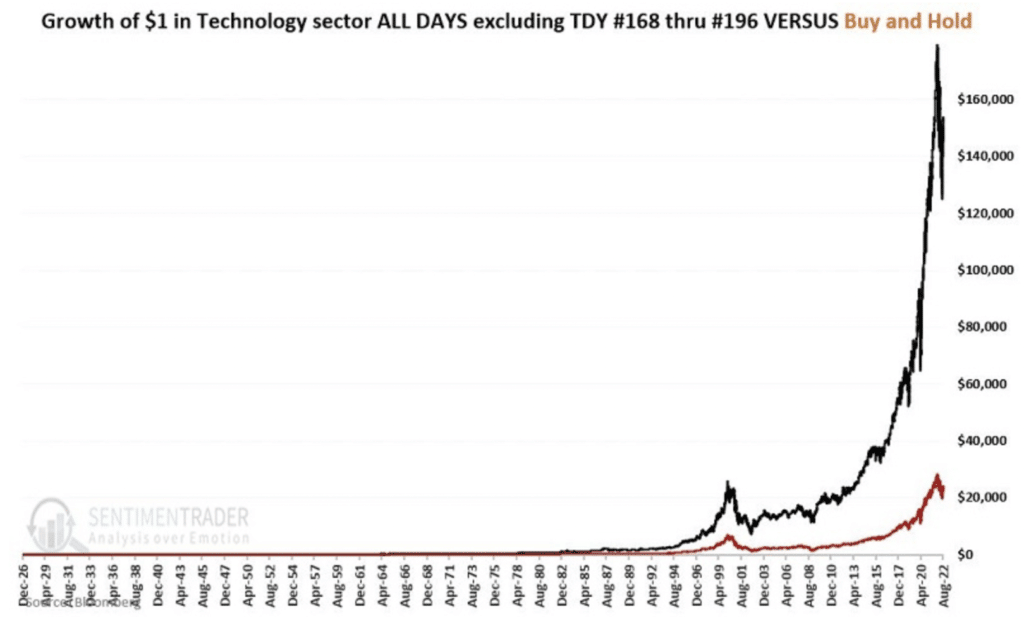
Over the past 100 years, your returns in technology would have been up by 7x by simply missing August 31st to October 12th. Importantly, they are NOT using Technology ETF $XLK for this, as the ETF only existed since 1998. Here’s the data in case you’re curious:
- 1927 – 1990: Information Technology Sector from Fama French database (indeed, tech existed before the internet)
- 1990 – Present: S&P 500 Information Technology Sector Index
Since I believe leaders will start their uptrends before the rest of the market, I’m keeping my eye on this sector, and will be more selective in any new names.
Communications Outperforming Since Mid-August
An obvious question, then, would be why my Roku & Twilio positions outperformed the general market this week. This is because Roku & Twilio are NOT in tech, they are communications companies. As the title explains, communications has been outperforming the S&P 500 since mid-August.
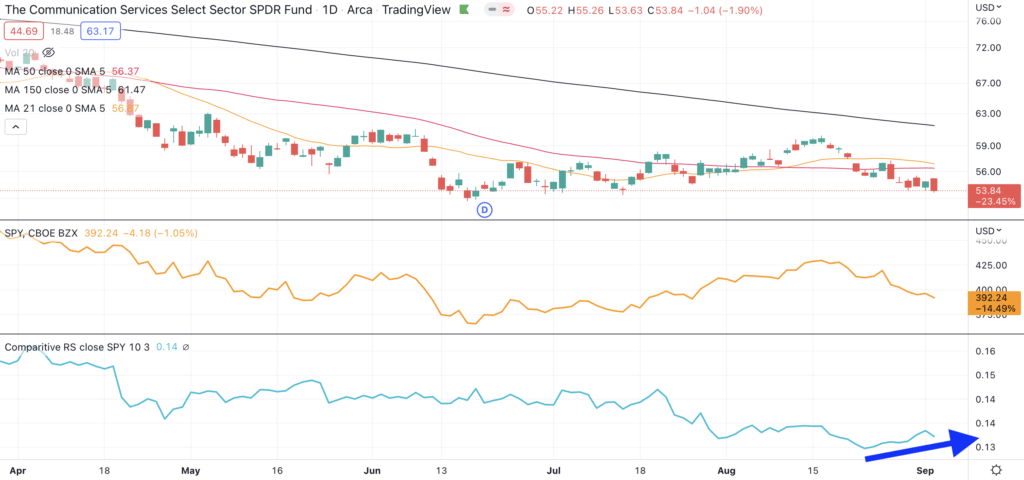
Many communication companies make money from advertising and marketing, including my holdings Roku & Twilio. Google, Facebook, Snap, & Pinterest all make most of their money from advertising and marketing as well.
I wrote about advertising’s Great Depression on July 29th, and while this chart suggests that things could be turning around, the sample size is still small. Let’s see how this plays out later in the year.
More “Peak Inflation” Evidence – LA Shipping Backlog Almost Cleared
I first wrote about inflation rolling over in the August 19th summary, suggesting that China’s economy is driving down commodity prices, namely copper and oil. We saw PCE decline last week, which strips out food and energy when calculating inflation.
We’re seeing more evidence this week, as the shipping backlog in Los Angeles is almost cleared.
With all of this encouraging news over the past 3 weeks, why have equities been falling? Clearly Powell’s speech at Jackson Hole sparked the selloff, but I had been raising stops anticipating this drawdown since late July. Perhaps this is due to the Fed, or perhaps this was coming either way.
Whatever the reason behind the selloff, it seems like institutional investors are ahead of this shopping backlog, as e-commerce companies have been outperforming since mid-May. Here’s online retail ETF $ONLN
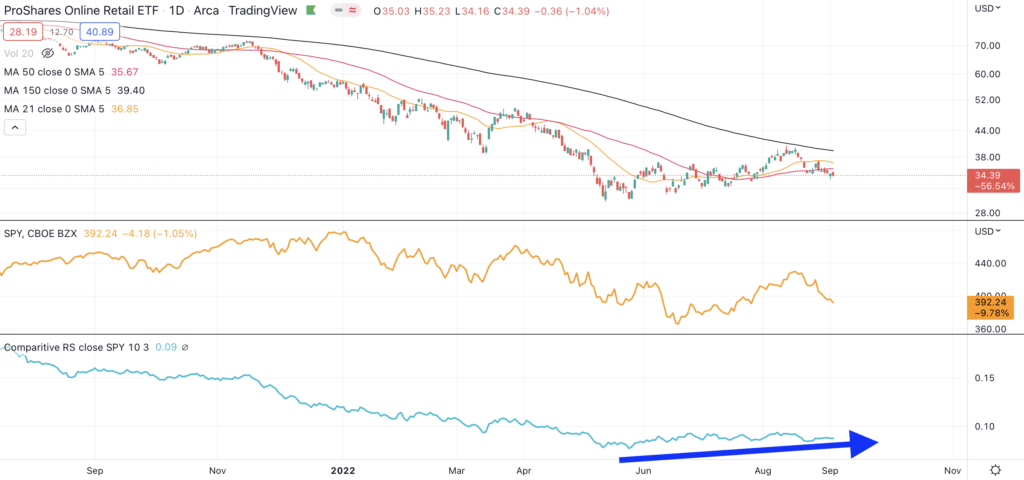
South Korean e-commerce company Coupang is one of my favorite in this space. Stanley Drunkenmiller loaded up on this, making it 18% of his portfolio earlier this year. This is his largest position behind Microsoft, which is 14% of his portfolio, and he has been selling them.

The next CPI print comes on September 13th, and I’m expecting a much lower number. This may be something I front run, depending on the upcoming evidence. I’ll keep you updated.
Market Trends
Which takes us to market trends. While we’re seeing some relative strength in this drawdown, solar is still the clear winner.
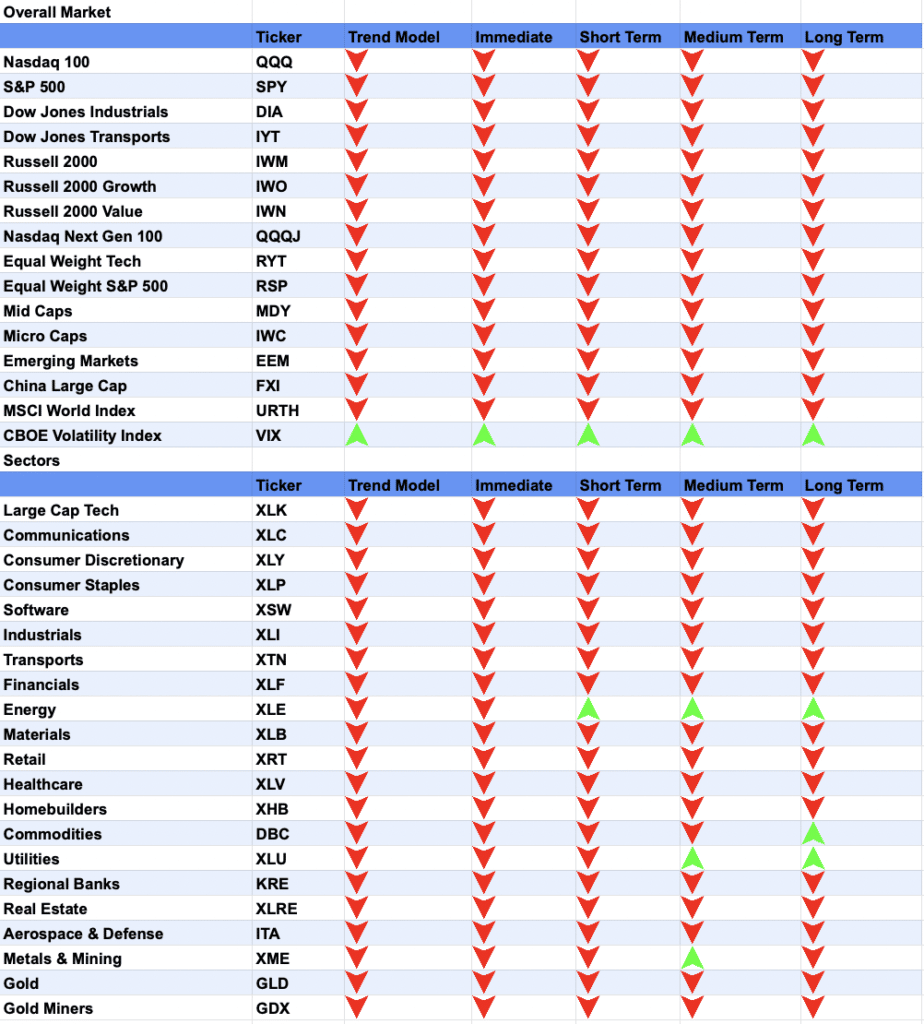
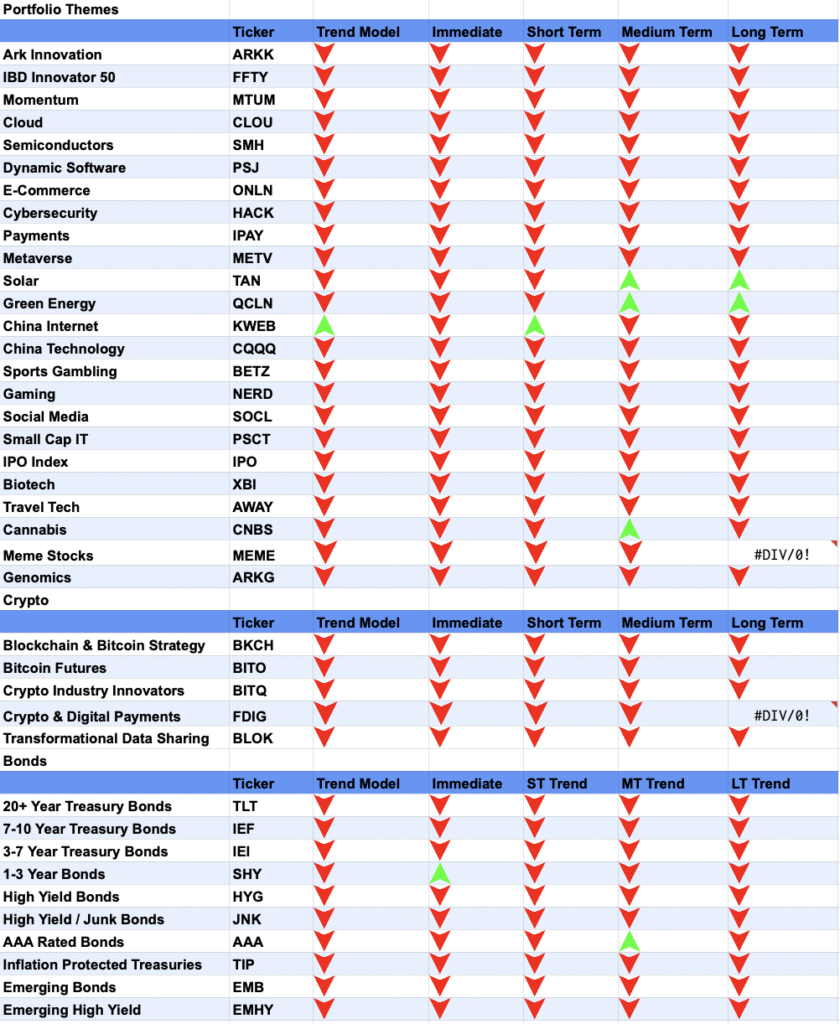
Energy is also outperforming, which is likely aligned with the bullish thesis around solar.
The other big takeaway is that bonds have completely rolled over. 10-Year yields show the big picture.
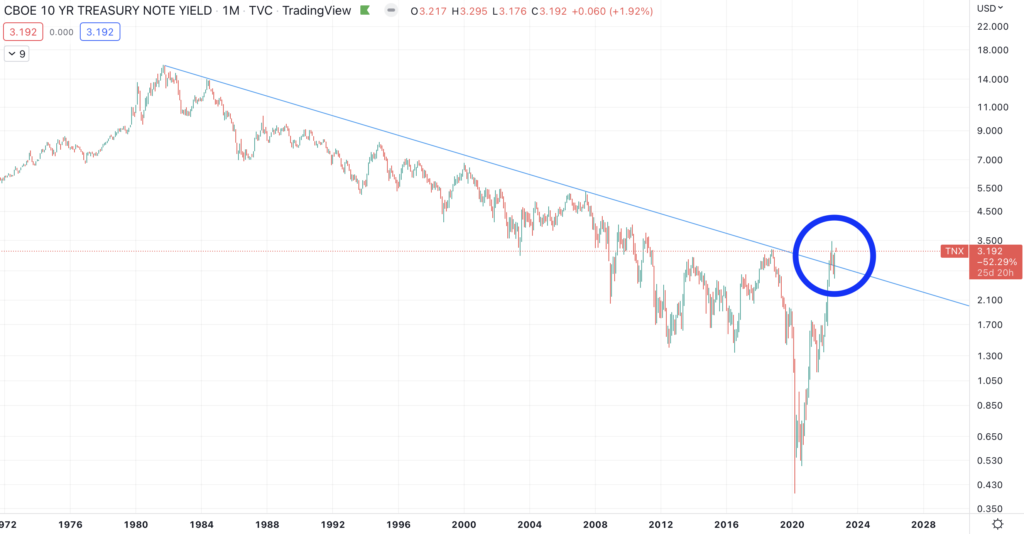
This has been called out before. Simply put, yields have been in a downtrend since Regan was president, which propelled an unprecedented bull market in equities and bonds.
We broke above that downtrend in April, and the longer we’re above this downtrend line, the more concerned I will be about our long term prospects.
Now let’s zoom in to the daily chart.
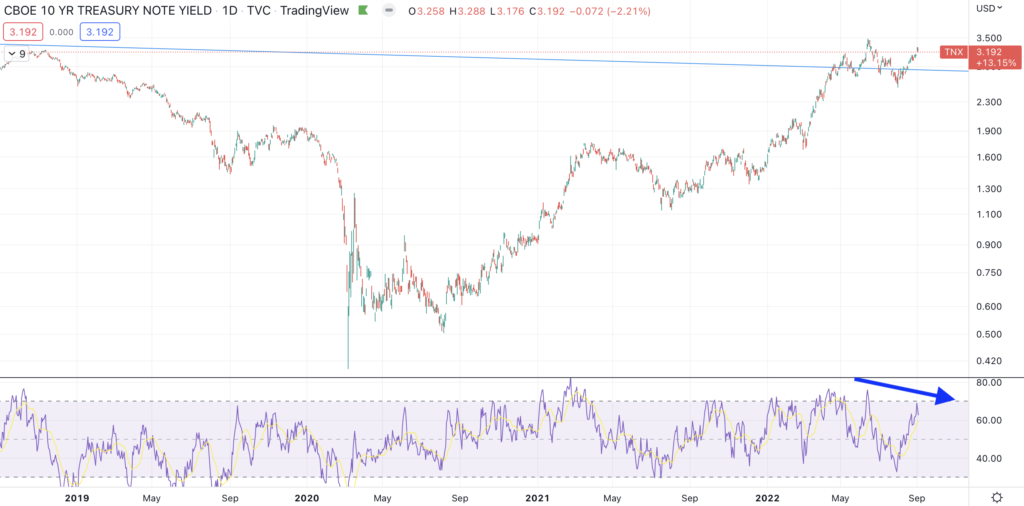
Yields peaked at 3.45% on June 15th, and they’re currently 3.19%.
I don’t believe we’ll eclipse this 3.45% number, given the disinflationary news we’re seeing, as well as the lower momentum as shown by the RSI (blue arrow).
A reversal below this long term threshold line, roughly 2.8%, would be quite bullish for equities and bonds. In fact, we saw how bullish this was during the last bear market rally. Unfortunately that breakdown did not stick, a lower CPI print is needed before we see this fall through.
Bought and Sold: S&P500 Futures (ESU2022)
Given how oversold the market is, I’m still betting on a bounce, but I sold this position since the market normally follows through on Friday’s loss with further losses the following Monday. I believe this is called the Monday effect.
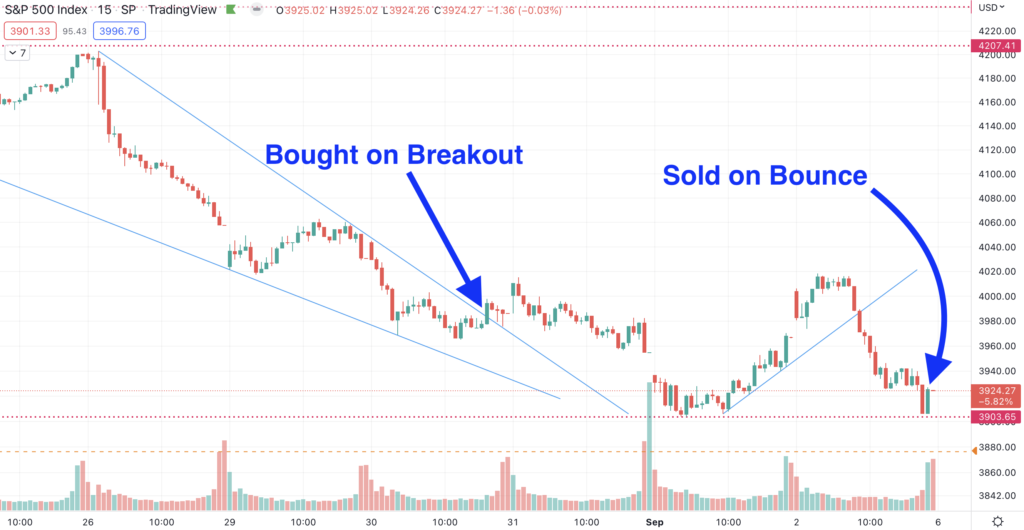
Notice how the market did not eclipse the low from 8am PST on September 1st (red dotted line at 3,903). I believe that is bullish, assuming it holds when futures open.
Given the Monday effect, along with the low overnight liquidity of futures, I felt it would be best selling on the bounce and waiting for follow through. This was sold at a 1.5% loss, and I believe the bounce will be substantially higher than 1.5% once it comes.