Hey Everyone,
I hope you had a great week, here’s a quick recap of last week’s plan:
- I was bearish this week, short equities and gold.
- My justification was the same as the prior two weeks
- Retail Investor Optimism was More Exuberant
- Equities Losing Steam Compared to RSI
- Disconnect Between Rising Yields & Rising Equities (Equities Should Fall w/ Rising Yields), Stating
- “Far more money is in the bond market, making it much more difficult to manipulate. Given that, my bias typically leans towards the bond market.”
That bias, for the 2nd week in a row, was totally wrong. The S&P 500 appreciated another +1.6% this week.
Portfolio & Market Updates
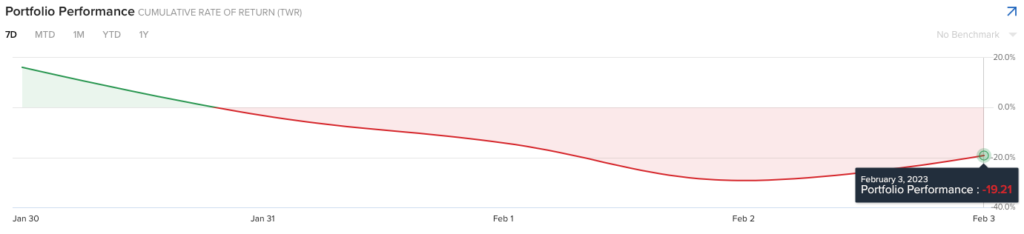
This was another bad week, down -19%, and once again well below my comps.
- S&P 500 (+1.6%)
- Nasdaq 100 (+3.3%)
- Ark (+6.1%)
- Small Cap Growth $IWO (+3.6%)
Same as last week, this reflects how dangerous futures can be, and why I’m replicating this with ETFs. The ETF losses in my paper trading account are not as severe, especially since they are 3x levered.
- SDOW (3x Short Dow): -2.1%
- SPXS (3x Short S&P 500): -8.1%
Once again, I apologize for getting this call wrong. While I believe this price action is encouraging for longer term bulls, I still don’t see enough evidence to change my mind. I’ll walk through some new data points.
Liquidity Is Falling While Valuations Are Rising
This is the big one. I wrote about the importance of liquidity, and how it drives market prices. Stanley Druckenmiller said it best back around 2015.
Earnings don’t move the overall market; it’s the Federal Reserve Board. Focus on the central banks, and focus on the movement of liquidity. Most people in the market are looking for earnings and conventional measures. It’s liquidity that moves markets.
I have been incorporating liquidity in my models, and have written about specific influencers over this time. For example, when I correctly forecasted that liquidity would rise before the November 2022 midterms.
With that being said, equities could have a decent run up until the November 8th elections. Putting myself in the shoes of those in power, I would do anything I could to boost equities, hoping voters elect on recency bias.
Now, the US Treasury General Account has given out a healthy amount of liquidity since they had over $900 billion the bank in May. As of November 2nd, they had less than $600 billion. My bet is that we’ll see even more money given out next week, which means more liquidity in the market.
If there is more liquidity, the 10 year yield could finally roll over, as some of that money would buy bonds. I started opening positions on November 2nd hoping this would happen, and while my positions have done well in aggregate, my thesis has not proven out yet.
Now that you have an example, let’s check out my liquidity model. First, a quick breakdown:
- Yellow Line: S&P 500
- Orange Line: Total Liquidity, as Defined by Me
- Light Blue Line: S&P 500 / Total Liquidity (market/liquidity)
- Blue Arrows: Previous market/liquidity peaks
- Expensive: Above red dotted line (short term bearish)
- Cheap: Below green dotted line (short term bullish)
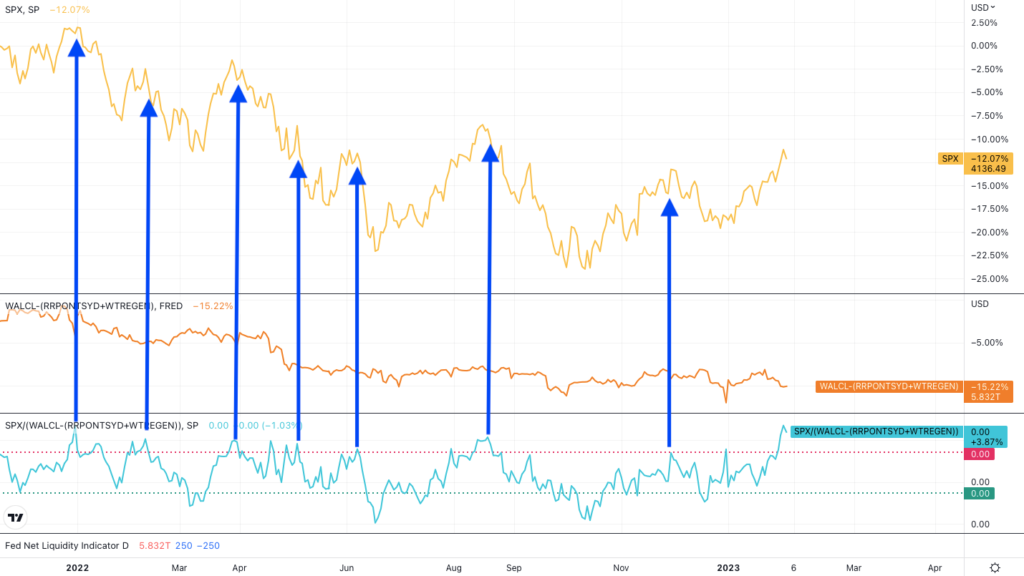
Notice where the light blue line is now – that is, another stratosphere. Either a ton of liquidity will enter this market, or prices should return to their longer term average.
By the way, a lot of people on Twitter are using similar models. I believe my edge has been thanks to correctly anticipating where liquidity would move. My equity shorts were opened January 19th, for example, and liquidity fell off a cliff 3 trading days after on January 24th.
Unfortunately for me, and great news for bulls, that liquidity drop has not lowered equity valuations. Instead, valuations/liquidity is at levels not seen since end of 2021.
While I believe this price action is encouraging for longer term bulls, liquidity is another reason why I’m not closing my shorts just yet. I keep saying that I’ll let you know if the evidence changes, and I haven’t seen it change yet.
Retail Optimism Getting Crazier & Markets Still Losing Steam
Just a quick update on these. Retail optimism (red line) rose further to multi-year highs, while smart money (blue line) fell below multi-year lows.
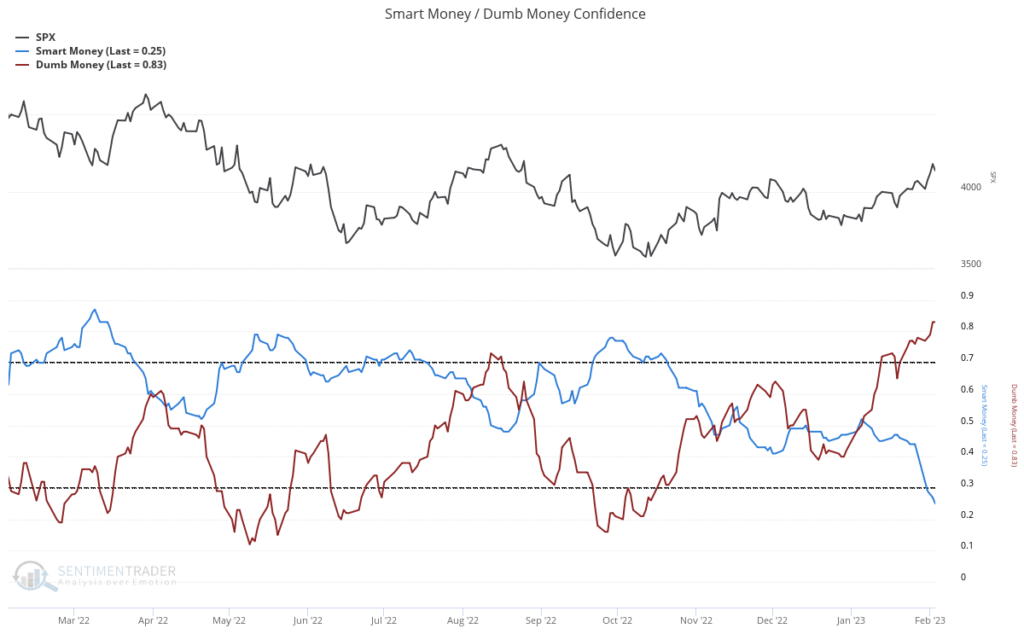
My thesis still stands on this – why would market makers bid up stocks when retail is making them so expensive? Why not remove them from the equation first and buy the same shares cheaper?
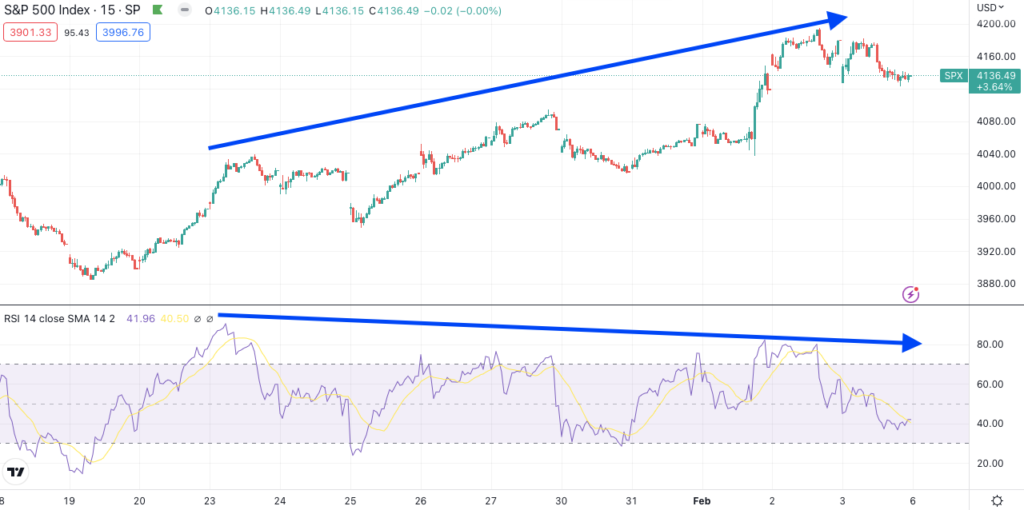
As for market momentum, last week’s divergence is even more pronounced. The S&P 500 broke out after Powell said the magic word “disinflation”, but the RSI couldn’t recapture January 23rd highs. This is despite prices being far higher.
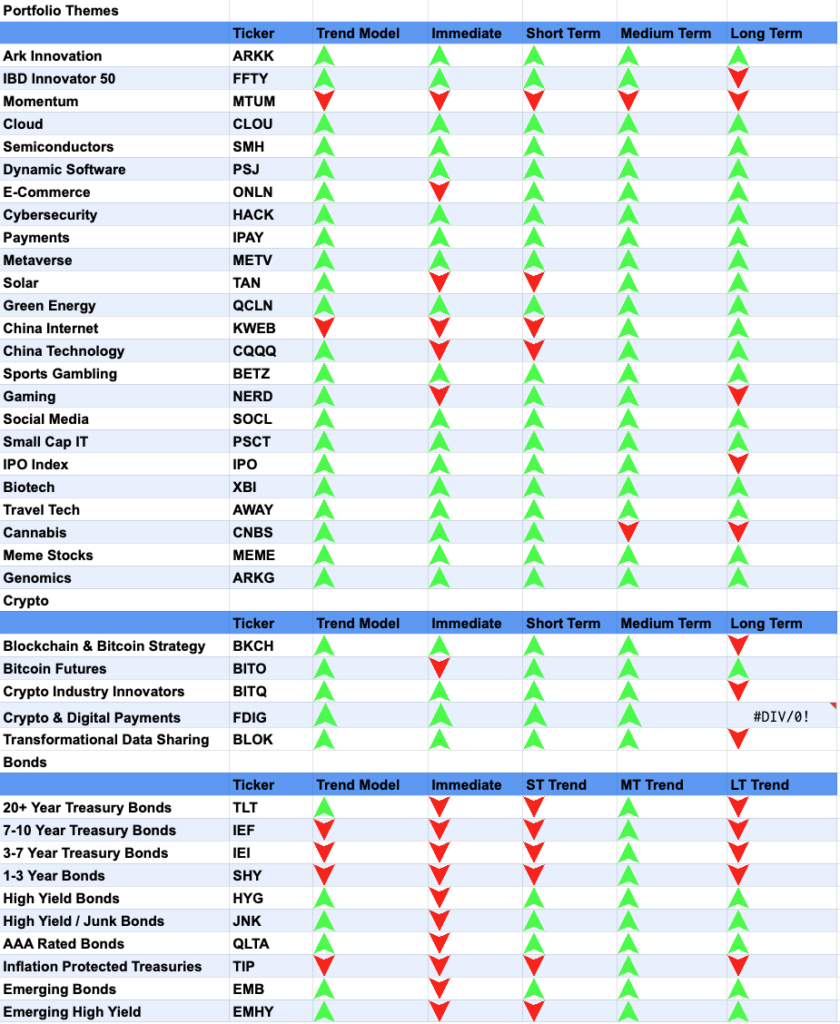
Market Trends: Gaming, Cannabis, and IPOs Are Laggards
Since basically everything is green, let’s highlight the industries who are still behind: gaming, cannabis, and recent IPOs.
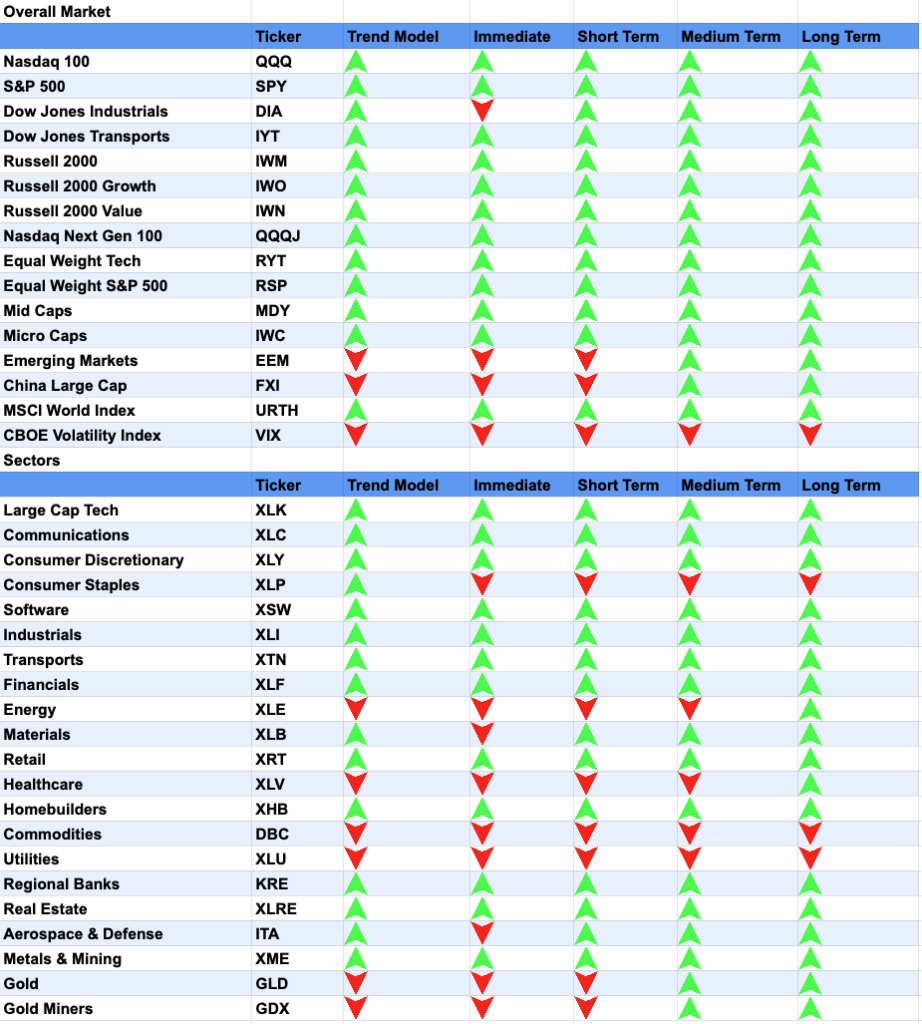
I believe gaming is thanks to Electronic Arts tanking earnings, which fell 10% the following day. EA is one of NERD’s biggest holdings.
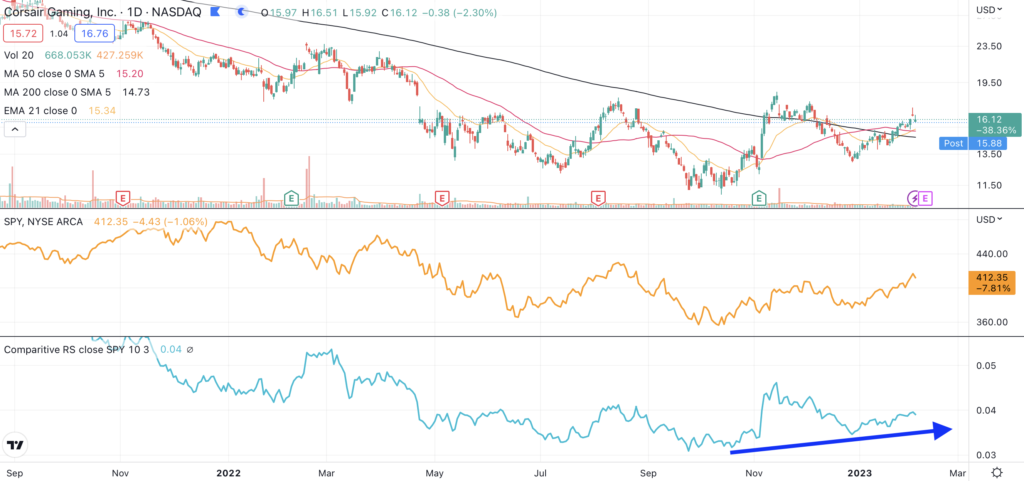
Two gaming companies that look great are former holdings, Corsair Gaming & Roblox.
I held a position in Corsair previously, believing it could be the next Logitech. They have outperformed the S&P 500 since November, and are only valued at 1x sales.
Another prior holding, and popular name, is Roblox. They have outperformed over January, as we saw money shift back into growth.
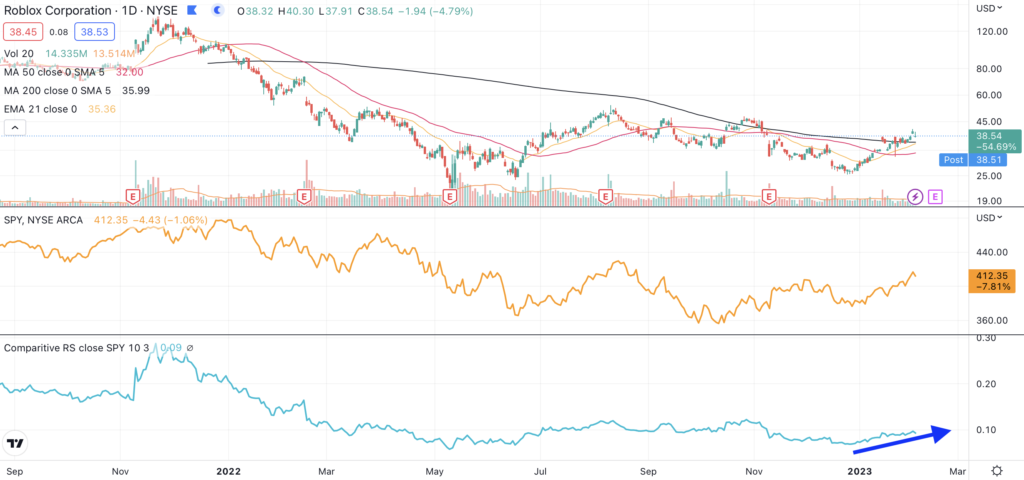
Both of these charts look awesome. Longer term moving averages are flattening, which should turn off many algos who sell off when moving averages are sloping down. I’m not planning on opening names given my short-term bearishness, but these charts are encouraging.
Futures: Still Short Equities & Gold
Nothing has changed with my thesis two weeks ago, but I sure have been punished for missing this. I still believe the data supports my immediate thesis, and included my liquidity model in this week’s breakdown.
We finally saw the yield shoot up, which is a result of lower liquidity. The blue line shows the inverse yield below, and equity valuations typically correlate with inverse yields (rising yields = lower equities).
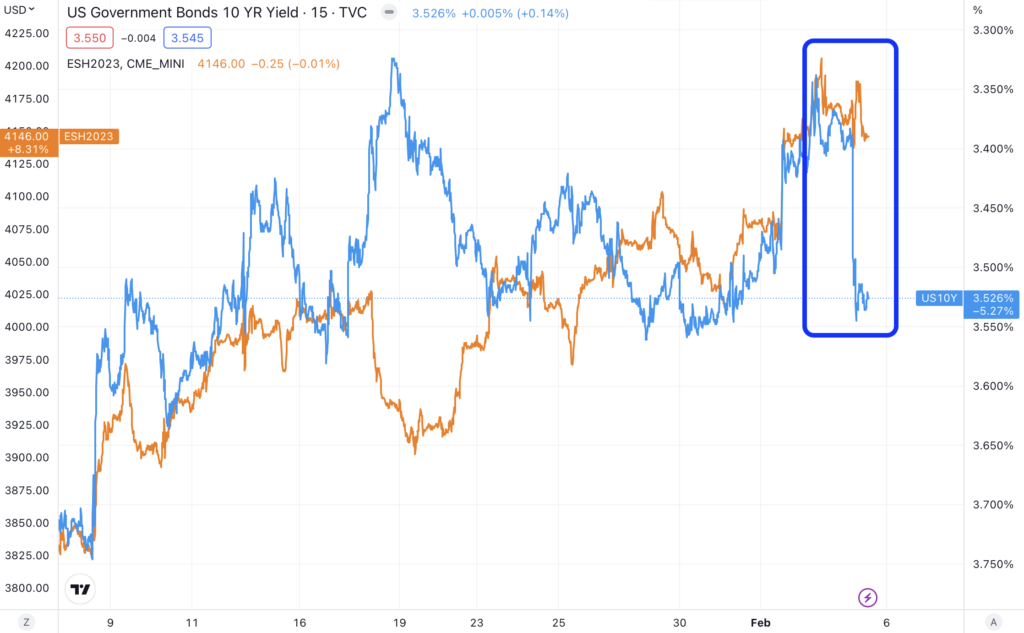
While the S&P 500 fell a little today, it was nothing compared to yields. We’ll see what happens next week, until then, please accept my apologies for getting this short call so wrong.